000089353812-312022FYfalseP3YP3YP3YP3YP3YP3YP3YP3YP6MP6MP3Yhttp://fasb.org/us-gaap/2022#GeneralAndAdministrativeExpensehttp://fasb.org/us-gaap/2022#GeneralAndAdministrativeExpensehttp://fasb.org/us-gaap/2022#GeneralAndAdministrativeExpensehttp://fasb.org/us-gaap/2022#GeneralAndAdministrativeExpensehttp://fasb.org/us-gaap/2022#GeneralAndAdministrativeExpensehttp://fasb.org/us-gaap/2022#GeneralAndAdministrativeExpensehttp://fasb.org/us-gaap/2022#GeneralAndAdministrativeExpensehttp://fasb.org/us-gaap/2022#GeneralAndAdministrativeExpensehttp://fasb.org/us-gaap/2022#GeneralAndAdministrativeExpensehttp://fasb.org/us-gaap/2022#GeneralAndAdministrativeExpensehttp://fasb.org/us-gaap/2022#GeneralAndAdministrativeExpensehttp://fasb.org/us-gaap/2022#GeneralAndAdministrativeExpensehttp://fasb.org/us-gaap/2022#GeneralAndAdministrativeExpensehttp://fasb.org/us-gaap/2022#GeneralAndAdministrativeExpensehttp://fasb.org/us-gaap/2022#OtherComprehensiveIncomeDefinedBenefitPlansAdjustmentNetOfTaxPortionAttributableToParenthttp://fasb.org/us-gaap/2022#OtherComprehensiveIncomeDefinedBenefitPlansAdjustmentNetOfTaxPortionAttributableToParenthttp://fasb.org/us-gaap/2022#OtherAssetsNoncurrenthttp://fasb.org/us-gaap/2022#OtherAssetsNoncurrenthttp://fasb.org/us-gaap/2022#OtherLiabilitiesCurrenthttp://fasb.org/us-gaap/2022#OtherLiabilitiesCurrenthttp://fasb.org/us-gaap/2022#OtherLiabilitiesNoncurrenthttp://fasb.org/us-gaap/2022#OtherLiabilitiesNoncurrent00008935382022-01-012022-12-3100008935382022-06-30iso4217:USD00008935382023-02-09xbrli:shares00008935382022-12-3100008935382021-12-31iso4217:USDxbrli:shares00008935382021-01-012021-12-3100008935382020-01-012020-12-310000893538us-gaap:CommonStockMember2019-12-310000893538us-gaap:AdditionalPaidInCapitalMember2019-12-310000893538us-gaap:RetainedEarningsMember2019-12-310000893538us-gaap:AccumulatedOtherComprehensiveIncomeMember2019-12-3100008935382019-12-310000893538us-gaap:RetainedEarningsMember2020-01-012020-12-310000893538us-gaap:AccumulatedOtherComprehensiveIncomeMember2020-01-012020-12-310000893538us-gaap:CommonStockMember2020-01-012020-12-310000893538us-gaap:AdditionalPaidInCapitalMember2020-01-012020-12-310000893538us-gaap:CommonStockMember2020-12-310000893538us-gaap:AdditionalPaidInCapitalMember2020-12-310000893538us-gaap:RetainedEarningsMember2020-12-310000893538us-gaap:AccumulatedOtherComprehensiveIncomeMember2020-12-3100008935382020-12-310000893538us-gaap:RetainedEarningsMember2021-01-012021-12-310000893538us-gaap:AccumulatedOtherComprehensiveIncomeMember2021-01-012021-12-310000893538us-gaap:CommonStockMember2021-01-012021-12-310000893538us-gaap:AdditionalPaidInCapitalMember2021-01-012021-12-310000893538us-gaap:CommonStockMember2021-12-310000893538us-gaap:AdditionalPaidInCapitalMember2021-12-310000893538us-gaap:RetainedEarningsMember2021-12-310000893538us-gaap:AccumulatedOtherComprehensiveIncomeMember2021-12-310000893538us-gaap:RetainedEarningsMember2022-01-012022-12-310000893538us-gaap:AccumulatedOtherComprehensiveIncomeMember2022-01-012022-12-310000893538us-gaap:CommonStockMember2022-01-012022-12-310000893538us-gaap:AdditionalPaidInCapitalMember2022-01-012022-12-310000893538us-gaap:CommonStockMember2022-12-310000893538us-gaap:AdditionalPaidInCapitalMember2022-12-310000893538us-gaap:RetainedEarningsMember2022-12-310000893538us-gaap:AccumulatedOtherComprehensiveIncomeMember2022-12-310000893538srt:MinimumMember2022-01-012022-12-310000893538srt:MaximumMember2022-01-012022-12-310000893538sm:MajorCustomerOneMemberus-gaap:CustomerConcentrationRiskMembersm:OilGasandNGLsSalesRevenueMember2022-01-012022-12-31xbrli:pure0000893538sm:MajorCustomerOneMemberus-gaap:CustomerConcentrationRiskMembersm:OilGasandNGLsSalesRevenueMember2021-01-012021-12-310000893538sm:MajorCustomerOneMemberus-gaap:CustomerConcentrationRiskMembersm:OilGasandNGLsSalesRevenueMember2020-01-012020-12-310000893538sm:MajorCustomerTwoMemberus-gaap:CustomerConcentrationRiskMembersm:OilGasandNGLsSalesRevenueMember2022-01-012022-12-310000893538sm:MajorCustomerTwoMemberus-gaap:CustomerConcentrationRiskMembersm:OilGasandNGLsSalesRevenueMember2021-01-012021-12-310000893538sm:MajorCustomerTwoMemberus-gaap:CustomerConcentrationRiskMembersm:OilGasandNGLsSalesRevenueMember2020-01-012020-12-310000893538us-gaap:CustomerConcentrationRiskMembersm:OilGasandNGLsSalesRevenueMembersm:MajorCustomerThreeMember2022-01-012022-12-310000893538us-gaap:CustomerConcentrationRiskMembersm:OilGasandNGLsSalesRevenueMembersm:MajorCustomerThreeMember2021-01-012021-12-310000893538us-gaap:CustomerConcentrationRiskMembersm:OilGasandNGLsSalesRevenueMembersm:MajorCustomerThreeMember2020-01-012020-12-310000893538sm:UnnamedMajorCustomerGroupOnewithRelatedEntitiesMemberus-gaap:CustomerConcentrationRiskMembersm:OilGasandNGLsSalesRevenueMember2022-01-012022-12-310000893538sm:UnnamedMajorCustomerGroupOnewithRelatedEntitiesMemberus-gaap:CustomerConcentrationRiskMembersm:OilGasandNGLsSalesRevenueMember2021-01-012021-12-310000893538sm:UnnamedMajorCustomerGroupOnewithRelatedEntitiesMemberus-gaap:CustomerConcentrationRiskMembersm:OilGasandNGLsSalesRevenueMember2020-01-012020-12-310000893538us-gaap:OilAndGasPropertiesMemberus-gaap:FairValueMeasurementsNonrecurringMemberus-gaap:MeasurementInputDiscountRateMembersrt:MinimumMember2022-12-310000893538us-gaap:OilAndGasPropertiesMemberus-gaap:FairValueMeasurementsNonrecurringMemberus-gaap:MeasurementInputDiscountRateMembersrt:MaximumMember2022-12-310000893538us-gaap:OilAndGasPropertiesMember2022-12-310000893538us-gaap:PropertyPlantAndEquipmentOtherTypesMembersrt:MinimumMember2022-01-012022-12-310000893538us-gaap:PropertyPlantAndEquipmentOtherTypesMembersrt:MaximumMember2022-01-012022-12-310000893538srt:MinimumMemberus-gaap:MeasurementInputRiskFreeInterestRateMemberus-gaap:AssetRetirementObligationCostsMember2022-12-310000893538us-gaap:MeasurementInputRiskFreeInterestRateMembersrt:MaximumMemberus-gaap:AssetRetirementObligationCostsMember2022-12-310000893538sm:OilRevenueMembersm:MidlandBasinMember2022-01-012022-12-310000893538sm:OilRevenueMembersm:SouthTexasMember2022-01-012022-12-310000893538sm:OilRevenueMember2022-01-012022-12-310000893538sm:NaturalGasRevenueMembersm:MidlandBasinMember2022-01-012022-12-310000893538sm:NaturalGasRevenueMembersm:SouthTexasMember2022-01-012022-12-310000893538sm:NaturalGasRevenueMember2022-01-012022-12-310000893538sm:OilandCondensateRevenueMembersm:MidlandBasinMember2022-01-012022-12-310000893538sm:OilandCondensateRevenueMembersm:SouthTexasMember2022-01-012022-12-310000893538sm:OilandCondensateRevenueMember2022-01-012022-12-310000893538sm:MidlandBasinMember2022-01-012022-12-310000893538sm:SouthTexasMember2022-01-012022-12-310000893538us-gaap:SalesRevenueNetMemberus-gaap:GeographicConcentrationRiskMembersm:MidlandBasinMember2022-01-012022-12-310000893538us-gaap:SalesRevenueNetMemberus-gaap:GeographicConcentrationRiskMembersm:SouthTexasMember2022-01-012022-12-310000893538us-gaap:SalesRevenueNetMemberus-gaap:GeographicConcentrationRiskMember2022-01-012022-12-310000893538sm:OilRevenueMembersm:MidlandBasinMember2021-01-012021-12-310000893538sm:OilRevenueMembersm:SouthTexasMember2021-01-012021-12-310000893538sm:OilRevenueMember2021-01-012021-12-310000893538sm:NaturalGasRevenueMembersm:MidlandBasinMember2021-01-012021-12-310000893538sm:NaturalGasRevenueMembersm:SouthTexasMember2021-01-012021-12-310000893538sm:NaturalGasRevenueMember2021-01-012021-12-310000893538sm:OilandCondensateRevenueMembersm:MidlandBasinMember2021-01-012021-12-310000893538sm:OilandCondensateRevenueMembersm:SouthTexasMember2021-01-012021-12-310000893538sm:OilandCondensateRevenueMember2021-01-012021-12-310000893538sm:MidlandBasinMember2021-01-012021-12-310000893538sm:SouthTexasMember2021-01-012021-12-310000893538us-gaap:SalesRevenueNetMemberus-gaap:GeographicConcentrationRiskMembersm:MidlandBasinMember2021-01-012021-12-310000893538us-gaap:SalesRevenueNetMemberus-gaap:GeographicConcentrationRiskMembersm:SouthTexasMember2021-01-012021-12-310000893538us-gaap:SalesRevenueNetMemberus-gaap:GeographicConcentrationRiskMember2021-01-012021-12-310000893538sm:OilRevenueMembersm:MidlandBasinMember2020-01-012020-12-310000893538sm:OilRevenueMembersm:SouthTexasMember2020-01-012020-12-310000893538sm:OilRevenueMember2020-01-012020-12-310000893538sm:NaturalGasRevenueMembersm:MidlandBasinMember2020-01-012020-12-310000893538sm:NaturalGasRevenueMembersm:SouthTexasMember2020-01-012020-12-310000893538sm:NaturalGasRevenueMember2020-01-012020-12-310000893538sm:OilandCondensateRevenueMembersm:MidlandBasinMember2020-01-012020-12-310000893538sm:OilandCondensateRevenueMembersm:SouthTexasMember2020-01-012020-12-310000893538sm:OilandCondensateRevenueMember2020-01-012020-12-310000893538sm:MidlandBasinMember2020-01-012020-12-310000893538sm:SouthTexasMember2020-01-012020-12-310000893538us-gaap:SalesRevenueNetMemberus-gaap:GeographicConcentrationRiskMembersm:MidlandBasinMember2020-01-012020-12-310000893538us-gaap:SalesRevenueNetMemberus-gaap:GeographicConcentrationRiskMembersm:SouthTexasMember2020-01-012020-12-310000893538us-gaap:SalesRevenueNetMemberus-gaap:GeographicConcentrationRiskMember2020-01-012020-12-310000893538us-gaap:AccruedIncomeReceivableMember2022-12-310000893538us-gaap:AccruedIncomeReceivableMember2021-12-3100008935382022-09-0700008935382022-09-072022-09-070000893538sm:August1998StockRepurchaseAuthorizationTerminatedMember2022-12-3100008935382020-06-1700008935382021-01-152021-01-1500008935382020-06-172020-06-170000893538srt:WeightedAverageMember2021-12-3100008935382022-10-012022-12-310000893538us-gaap:DomesticCountryMemberus-gaap:InternalRevenueServiceIRSMember2022-12-310000893538us-gaap:DomesticCountryMemberus-gaap:InternalRevenueServiceIRSMember2021-12-310000893538us-gaap:StateAndLocalJurisdictionMember2022-12-310000893538us-gaap:StateAndLocalJurisdictionMember2021-12-310000893538us-gaap:RevolvingCreditFacilityMember2022-12-310000893538us-gaap:RevolvingCreditFacilityMember2022-12-312022-12-310000893538us-gaap:LineOfCreditMemberus-gaap:SecuredOvernightFinancingRateSofrOvernightIndexSwapRateMembersm:BorrowingBaseUtilizationOfLessThan25PercentMember2022-01-012022-12-310000893538us-gaap:LineOfCreditMemberus-gaap:SecuredOvernightFinancingRateSofrOvernightIndexSwapRateMembersm:BorrowingBaseUtilizationOf25PercentOrMoreButLessThan50PercentMember2022-01-012022-12-310000893538sm:BorrowingBaseUtilizationOf50PercentOrMoreButLessThan75PercentMemberus-gaap:LineOfCreditMemberus-gaap:SecuredOvernightFinancingRateSofrOvernightIndexSwapRateMember2022-01-012022-12-310000893538us-gaap:LineOfCreditMembersm:BorrowingBaseUtilizationOf75PercentOrMoreButLessThan90PercentMemberus-gaap:SecuredOvernightFinancingRateSofrOvernightIndexSwapRateMember2022-01-012022-12-310000893538us-gaap:LineOfCreditMemberus-gaap:SecuredOvernightFinancingRateSofrOvernightIndexSwapRateMembersm:BorrowingBaseUtilizationOf90PercentOrMoreMember2022-01-012022-12-310000893538us-gaap:PrimeRateMemberus-gaap:LineOfCreditMembersm:BorrowingBaseUtilizationOfLessThan25PercentMember2022-01-012022-12-310000893538us-gaap:PrimeRateMemberus-gaap:LineOfCreditMembersm:BorrowingBaseUtilizationOf25PercentOrMoreButLessThan50PercentMember2022-01-012022-12-310000893538sm:BorrowingBaseUtilizationOf50PercentOrMoreButLessThan75PercentMemberus-gaap:PrimeRateMemberus-gaap:LineOfCreditMember2022-01-012022-12-310000893538us-gaap:PrimeRateMemberus-gaap:LineOfCreditMembersm:BorrowingBaseUtilizationOf75PercentOrMoreButLessThan90PercentMember2022-01-012022-12-310000893538us-gaap:PrimeRateMemberus-gaap:LineOfCreditMembersm:BorrowingBaseUtilizationOf90PercentOrMoreMember2022-01-012022-12-310000893538us-gaap:LineOfCreditMembersm:BorrowingBaseUtilizationOfLessThan25PercentMember2022-01-012022-12-310000893538us-gaap:LineOfCreditMembersm:BorrowingBaseUtilizationOf25PercentOrMoreButLessThan50PercentMember2022-01-012022-12-310000893538sm:BorrowingBaseUtilizationOf50PercentOrMoreButLessThan75PercentMemberus-gaap:LineOfCreditMember2022-01-012022-12-310000893538us-gaap:LineOfCreditMembersm:BorrowingBaseUtilizationOf75PercentOrMoreButLessThan90PercentMember2022-01-012022-12-310000893538us-gaap:LineOfCreditMembersm:BorrowingBaseUtilizationOf90PercentOrMoreMember2022-01-012022-12-310000893538us-gaap:RevolvingCreditFacilityMemberus-gaap:SubsequentEventMember2023-02-090000893538us-gaap:RevolvingCreditFacilityMember2021-12-310000893538sm:A100SeniorSecuredNotesDue2025Member2022-12-310000893538sm:A100SeniorSecuredNotesDue2025Member2021-12-310000893538sm:A100SeniorSecuredNotesDue2025Member2020-06-170000893538sm:A150SeniorUnsecuredConvertibleNotesDue2021Member2016-08-120000893538sm:A150SeniorSecuredConvertibleNotesDue2021Member2021-12-310000893538sm:A150SeniorSecuredConvertibleNotesDue2021Member2022-12-310000893538sm:A150SeniorUnsecuredConvertibleNotesDue2021Member2016-08-122016-08-120000893538sm:A150SeniorSecuredConvertibleNotesDue2021Member2021-01-012021-12-310000893538sm:A150SeniorSecuredConvertibleNotesDue2021Member2020-01-012020-12-310000893538sm:A50SeniorUnsecuredNotesDue2024Member2021-12-310000893538sm:A50SeniorUnsecuredNotesDue2024Member2022-12-310000893538sm:A50SeniorUnsecuredNotesDue2024Member2013-05-200000893538sm:A5625SeniorUnsecuredNotesDue2025Member2021-12-310000893538sm:A5625SeniorUnsecuredNotesDue2025Member2022-12-310000893538sm:A5625SeniorUnsecuredNotesDue2025Member2015-05-210000893538sm:A675SeniorUnsecuredNotesDue2026Member2022-12-310000893538sm:A675SeniorUnsecuredNotesDue2026Member2021-12-310000893538sm:A675SeniorUnsecuredNotesDue2026Member2016-09-120000893538sm:A6625SeniorUnsecuredNotesDue2027Member2022-12-310000893538sm:A6625SeniorUnsecuredNotesDue2027Member2021-12-310000893538sm:A6625SeniorUnsecuredNotesDue2027Member2018-08-200000893538sm:A65SeniorUnsecuredNotesDue2028Member2022-12-310000893538sm:A65SeniorUnsecuredNotesDue2028Member2021-12-310000893538sm:A65SeniorUnsecuredNotesDue2028Member2021-06-230000893538sm:SeniorUnsecuredNotesMember2022-12-310000893538sm:SeniorUnsecuredNotesMember2021-12-310000893538sm:A6125SeniorUnsecuredNotesDue2022Member2014-11-170000893538sm:A6125SeniorUnsecuredNotesDue2022Member2022-12-310000893538sm:A6125SeniorUnsecuredNotesDue2022Member2021-12-310000893538sm:A6125SeniorUnsecuredNotesDue2022Member2014-11-172014-11-170000893538sm:A50SeniorUnsecuredNotesDue2024Member2013-05-202013-05-200000893538sm:A5625SeniorUnsecuredNotesDue2025Member2015-05-212015-05-210000893538sm:A675SeniorUnsecuredNotesDue2026Member2016-09-122016-09-120000893538sm:A6625SeniorUnsecuredNotesDue2027Member2018-08-202018-08-200000893538sm:A65SeniorUnsecuredNotesDue2028Member2021-06-232021-06-230000893538sm:A50SeniorUnsecuredNotesDue2024Member2022-02-140000893538sm:A50SeniorUnsecuredNotesDue2024Member2022-02-142022-02-140000893538sm:A100SeniorSecuredNotesDue2025Member2022-06-170000893538sm:A100SeniorSecuredNotesDue2025Member2022-06-172022-06-170000893538sm:A100SeniorSecuredNotesDue2025Membersm:AcceleratedUnamortizedDebtDiscountMember2022-06-172022-06-170000893538sm:AcceleratedUnamortizedDeferredFinancingCostsMembersm:A100SeniorSecuredNotesDue2025Member2022-06-172022-06-170000893538sm:A6125SeniorUnsecuredNotesDue2022Member2021-06-230000893538sm:A50SeniorUnsecuredNotesDue2024Member2021-06-230000893538sm:A6125SeniorUnsecuredNotesDue2022Member2021-06-300000893538sm:A6125SeniorUnsecuredNotesDue2022And50SeniorUnsecuredNotesDue2024Member2022-12-310000893538sm:A6125SeniorUnsecuredNotesDue2022And50SeniorUnsecuredNotesDue2024Member2021-01-012021-12-310000893538sm:AcceleratedUnamortizedDeferredFinancingCostsMembersm:A6125SeniorUnsecuredNotesDue2022And50SeniorUnsecuredNotesDue2024Member2021-01-012021-12-310000893538sm:A150SeniorSecuredConvertibleNotesDue2021Member2021-07-012021-07-010000893538sm:SeniorUnsecuredNotesMember2020-06-170000893538sm:A150SeniorUnsecuredConvertibleNotesDue2021Member2020-06-170000893538sm:A150SeniorUnsecuredConvertibleNotesDue2021Member2020-06-172020-06-170000893538sm:SeniorSecuredNotesSeniorUnsecuredNotesAnd150SeniorUnsecuredConvertibleNotesDue2021Member2020-06-172020-06-170000893538sm:AcceleratedUnamortizedDebtDiscountMembersm:SeniorSecuredNotesSeniorUnsecuredNotesAnd150SeniorUnsecuredConvertibleNotesDue2021Member2020-06-172020-06-170000893538sm:AcceleratedUnamortizedDeferredFinancingCostsMembersm:SeniorSecuredNotesSeniorUnsecuredNotesAnd150SeniorUnsecuredConvertibleNotesDue2021Member2020-06-172020-06-170000893538sm:A6125SeniorUnsecuredNotesDue2022Member2020-06-170000893538sm:A50SeniorUnsecuredNotesDue2024Member2020-06-170000893538sm:A5625SeniorUnsecuredNotesDue2025Member2020-06-170000893538sm:A675SeniorUnsecuredNotesDue2026Member2020-06-170000893538sm:A6625SeniorUnsecuredNotesDue2027Member2020-06-170000893538sm:A6125SeniorUnsecuredNotesDue2022Member2020-12-310000893538sm:A50SeniorUnsecuredNotesDue2024Member2020-12-310000893538sm:A6125SeniorUnsecuredNotesDue2022And50SeniorUnsecuredNotesDue2024Member2020-12-310000893538sm:A6125SeniorUnsecuredNotesDue2022And50SeniorUnsecuredNotesDue2024Member2020-01-012020-12-310000893538sm:AcceleratedUnamortizedDeferredFinancingCostsMembersm:A6125SeniorUnsecuredNotesDue2022And50SeniorUnsecuredNotesDue2024Member2020-01-012020-12-3100008935382022-12-312022-12-310000893538us-gaap:SubsequentEventMember2023-01-012023-02-230000893538sm:DrillingRigLeasingContractsMember2022-12-310000893538sm:PipelineCommitmentsMember2022-12-310000893538sm:OfficeSpaceLeasesMember2022-12-310000893538sm:ElectricityPurchaseAgreementMember2022-12-310000893538sm:SandSourcingCommitmentMember2022-12-310000893538sm:CompressorServiceContractMember2022-12-310000893538sm:OtherMiscellaneousContractsAndLeasesMember2022-12-310000893538srt:MinimumMembersm:CompletionServiceCommitmentMember2022-12-310000893538srt:MaximumMembersm:CompletionServiceCommitmentMember2022-12-310000893538sm:DrillingRigLeasingContractsMember2022-01-012022-12-310000893538sm:CrudeOilPipelineCommitmentMember2022-12-31utr:MMBbls0000893538sm:NaturalGasPipelineCommitmentMember2022-12-31utr:Bcf0000893538sm:WaterPipelineCommitmentMember2022-12-310000893538sm:CrudeOilPipelineCommitmentExcludedfromRemainingDeficiencyPaymentAmountMember2022-12-310000893538sm:OfficeSpaceLeasesMember2022-01-012022-12-310000893538sm:OfficeSpaceLeasesMember2021-01-012021-12-310000893538sm:OfficeSpaceLeasesMember2020-01-012020-12-310000893538srt:MinimumMembersm:SandSourcingCommitmentMember2022-12-310000893538sm:SandSourcingCommitmentMembersrt:MaximumMember2022-12-310000893538srt:MinimumMember2022-12-310000893538srt:MaximumMember2022-12-310000893538us-gaap:PerformanceSharesMember2022-01-012022-12-310000893538srt:MinimumMemberus-gaap:PerformanceSharesMember2022-12-310000893538us-gaap:PerformanceSharesMembersrt:MaximumMember2022-12-310000893538us-gaap:PerformanceSharesMember2021-01-012021-12-310000893538us-gaap:PerformanceSharesMember2020-01-012020-12-310000893538us-gaap:PerformanceSharesMember2022-12-310000893538us-gaap:PerformanceSharesMember2021-12-310000893538us-gaap:PerformanceSharesMember2020-12-310000893538us-gaap:PerformanceSharesMember2019-12-31sm:pure0000893538us-gaap:RestrictedStockUnitsRSUMember2022-12-310000893538us-gaap:RestrictedStockUnitsRSUMember2022-01-012022-12-310000893538us-gaap:RestrictedStockUnitsRSUMember2021-01-012021-12-310000893538us-gaap:RestrictedStockUnitsRSUMember2020-01-012020-12-310000893538us-gaap:RestrictedStockUnitsRSUMember2021-12-310000893538us-gaap:RestrictedStockUnitsRSUMember2020-12-310000893538us-gaap:RestrictedStockUnitsRSUMember2019-12-310000893538srt:DirectorMember2022-01-012022-12-310000893538srt:DirectorMember2021-01-012021-12-310000893538srt:DirectorMember2020-01-012020-12-310000893538sm:EmployeeStockPurchasePlanMember2022-12-310000893538sm:EmployeeStockPurchasePlanMember2022-01-012022-12-310000893538sm:EmployeeStockPurchasePlanMember2021-01-012021-12-310000893538sm:EmployeeStockPurchasePlanMember2020-01-012020-12-310000893538sm:A401KPlanMember2022-01-012022-12-310000893538sm:Priorto2014Membersm:A401KPlanMember2022-01-012022-12-310000893538sm:A401KPlanMembersm:After2014Member2022-01-012022-12-310000893538sm:A401KPlanMember2021-01-012021-12-310000893538sm:A401KPlanMember2020-01-012020-12-310000893538us-gaap:NondesignatedMemberus-gaap:FairValueMeasurementsRecurringMemberus-gaap:FairValueInputsLevel1Member2022-12-310000893538us-gaap:NondesignatedMemberus-gaap:FairValueMeasurementsRecurringMemberus-gaap:FairValueInputsLevel2Member2022-12-310000893538us-gaap:NondesignatedMemberus-gaap:FairValueMeasurementsRecurringMemberus-gaap:FairValueInputsLevel3Member2022-12-310000893538us-gaap:NondesignatedMemberus-gaap:FairValueMeasurementsRecurringMemberus-gaap:FairValueInputsLevel1Member2021-12-310000893538us-gaap:NondesignatedMemberus-gaap:FairValueMeasurementsRecurringMemberus-gaap:FairValueInputsLevel2Member2021-12-310000893538us-gaap:NondesignatedMemberus-gaap:FairValueMeasurementsRecurringMemberus-gaap:FairValueInputsLevel3Member2021-12-310000893538us-gaap:OilAndGasPropertiesMemberus-gaap:FairValueMeasurementsNonrecurringMemberus-gaap:MeasurementInputDiscountRateMember2020-12-310000893538sm:NYMEXOilSwapContractFirstQuarterYear1Member2022-12-312022-12-31utr:bbl0000893538sm:NYMEXOilSwapContractSecondQuarterYear1Member2022-12-312022-12-310000893538sm:NYMEXOilSwapContractThirdQuarterYear1Member2022-12-312022-12-310000893538sm:NYMEXOilSwapContractFourthQuarterYear1Member2022-12-312022-12-310000893538sm:NYMEXOilSwapContractYear2Member2022-12-312022-12-310000893538sm:NYMEXOilSwapContractYear3Member2022-12-312022-12-310000893538sm:NYMEXOilSwapContractFirstQuarterYear1Member2022-12-31iso4217:USDsm:Barrels0000893538sm:NYMEXOilSwapContractSecondQuarterYear1Member2022-12-310000893538sm:NYMEXOilSwapContractThirdQuarterYear1Member2022-12-310000893538sm:NYMEXOilSwapContractFourthQuarterYear1Member2022-12-310000893538sm:NYMEXOilSwapContractYear2Member2022-12-310000893538sm:NYMEXOilSwapContractYear3Member2022-12-310000893538sm:ICEBrentOilSwapContractFirstQuarterYear1Member2022-12-312022-12-310000893538sm:ICEBrentOilSwapContractSecondQuarterYear1Member2022-12-312022-12-310000893538sm:ICEBrentOilSwapContractThirdQuarterYear1Member2022-12-312022-12-310000893538sm:ICEBrentOilSwapContractFourthQuarterYear1Member2022-12-312022-12-310000893538sm:ICEBrentOilSwapContractYear2Member2022-12-312022-12-310000893538sm:ICEBrentOilSwapContractYear3Member2022-12-312022-12-310000893538sm:ICEBrentOilSwapContractFirstQuarterYear1Member2022-12-310000893538sm:ICEBrentOilSwapContractSecondQuarterYear1Member2022-12-310000893538sm:ICEBrentOilSwapContractThirdQuarterYear1Member2022-12-310000893538sm:ICEBrentOilSwapContractFourthQuarterYear1Member2022-12-310000893538sm:ICEBrentOilSwapContractYear2Member2022-12-310000893538sm:ICEBrentOilSwapContractYear3Member2022-12-310000893538sm:NYMEXOilCollarContractFirstQuarterYear1Member2022-12-312022-12-310000893538sm:NYMEXOilCollarContractSecondQuarterYear1Member2022-12-312022-12-310000893538sm:NYMEXOilCollarContractThirdQuarterYear1Member2022-12-312022-12-310000893538sm:NYMEXOilCollarContractFourthQuarterYear1Member2022-12-312022-12-310000893538sm:NYMEXOilCollarContractYear2Member2022-12-312022-12-310000893538sm:NYMEXOilCollarContractYear3Member2022-12-312022-12-310000893538sm:NYMEXOilCollarContractFirstQuarterYear1Member2022-12-310000893538sm:NYMEXOilCollarContractSecondQuarterYear1Member2022-12-310000893538sm:NYMEXOilCollarContractThirdQuarterYear1Member2022-12-310000893538sm:NYMEXOilCollarContractFourthQuarterYear1Member2022-12-310000893538sm:NYMEXOilCollarContractYear2Member2022-12-310000893538sm:NYMEXOilCollarContractYear3Member2022-12-310000893538sm:OilBasisSwapContractFirstQuarterYear1Membersm:WTIMidlandNYMEXWTIMember2022-12-312022-12-310000893538sm:WTIMidlandNYMEXWTIMembersm:OilBasisSwapContractSecondQuarterYear1Member2022-12-312022-12-310000893538sm:OilBasisSwapContractThirdQuarterYear1Membersm:WTIMidlandNYMEXWTIMember2022-12-312022-12-310000893538sm:WTIMidlandNYMEXWTIMembersm:OilBasisSwapContractFourthQuarterYear1Member2022-12-312022-12-310000893538sm:WTIMidlandNYMEXWTIMembersm:OilBasisSwapContractYear2Member2022-12-312022-12-310000893538sm:OilBasisSwapContractYear3Membersm:WTIMidlandNYMEXWTIMember2022-12-312022-12-310000893538sm:OilBasisSwapContractFirstQuarterYear1Membersm:WTIMidlandNYMEXWTIMember2022-12-310000893538sm:WTIMidlandNYMEXWTIMembersm:OilBasisSwapContractSecondQuarterYear1Member2022-12-310000893538sm:OilBasisSwapContractThirdQuarterYear1Membersm:WTIMidlandNYMEXWTIMember2022-12-310000893538sm:WTIMidlandNYMEXWTIMembersm:OilBasisSwapContractFourthQuarterYear1Member2022-12-310000893538sm:WTIMidlandNYMEXWTIMembersm:OilBasisSwapContractYear2Member2022-12-310000893538sm:OilBasisSwapContractYear3Membersm:WTIMidlandNYMEXWTIMember2022-12-310000893538sm:OilBasisSwapContractFirstQuarterYear1Membersm:WTIHoustonMEHNYMEXWTIMember2022-12-312022-12-310000893538sm:WTIHoustonMEHNYMEXWTIMembersm:OilBasisSwapContractSecondQuarterYear1Member2022-12-312022-12-310000893538sm:OilBasisSwapContractThirdQuarterYear1Membersm:WTIHoustonMEHNYMEXWTIMember2022-12-312022-12-310000893538sm:WTIHoustonMEHNYMEXWTIMembersm:OilBasisSwapContractFourthQuarterYear1Member2022-12-312022-12-310000893538sm:WTIHoustonMEHNYMEXWTIMembersm:OilBasisSwapContractYear2Member2022-12-312022-12-310000893538sm:OilBasisSwapContractYear3Membersm:WTIHoustonMEHNYMEXWTIMember2022-12-312022-12-310000893538sm:OilBasisSwapContractFirstQuarterYear1Membersm:WTIHoustonMEHNYMEXWTIMember2022-12-310000893538sm:WTIHoustonMEHNYMEXWTIMembersm:OilBasisSwapContractSecondQuarterYear1Member2022-12-310000893538sm:OilBasisSwapContractThirdQuarterYear1Membersm:WTIHoustonMEHNYMEXWTIMember2022-12-310000893538sm:WTIHoustonMEHNYMEXWTIMembersm:OilBasisSwapContractFourthQuarterYear1Member2022-12-310000893538sm:WTIHoustonMEHNYMEXWTIMembersm:OilBasisSwapContractYear2Member2022-12-310000893538sm:OilBasisSwapContractYear3Membersm:WTIHoustonMEHNYMEXWTIMember2022-12-310000893538sm:NYMEXOilCalendarMonthAverageRollDifferentialContractFirstQuarterYear1Member2022-12-312022-12-310000893538sm:NYMEXOilCalendarMonthAverageRollDifferentialContractSecondQuarterYear1Member2022-12-312022-12-310000893538sm:NYMEXOilCalendarMonthAverageRollDifferentialContractThirdQuarterYear1Member2022-12-312022-12-310000893538sm:NYMEXOilCalendarMonthAverageRollDifferentialContractFourthQuarterYear1Member2022-12-312022-12-310000893538sm:NYMEXOilCalendarMonthAverageRollDifferentialContractYear2Member2022-12-312022-12-310000893538sm:NYMEXOilCalendarMonthAverageRollDifferentialContractYear3Member2022-12-312022-12-310000893538sm:NYMEXOilCalendarMonthAverageRollDifferentialContractFirstQuarterYear1Member2022-12-310000893538sm:NYMEXOilCalendarMonthAverageRollDifferentialContractSecondQuarterYear1Member2022-12-310000893538sm:NYMEXOilCalendarMonthAverageRollDifferentialContractThirdQuarterYear1Member2022-12-310000893538sm:NYMEXOilCalendarMonthAverageRollDifferentialContractFourthQuarterYear1Member2022-12-310000893538sm:NYMEXOilCalendarMonthAverageRollDifferentialContractYear2Member2022-12-310000893538sm:NYMEXOilCalendarMonthAverageRollDifferentialContractYear3Member2022-12-310000893538sm:NYMEXHHMembersm:GasSwapsContractFirstQuarterYear1Member2022-12-312022-12-31utr:Btu0000893538sm:NYMEXHHMembersm:GasSwapsContractSecondQuarterYear1Member2022-12-312022-12-310000893538sm:GasSwapsContractThirdQuarterYear1Membersm:NYMEXHHMember2022-12-312022-12-310000893538sm:GasSwapsContractFourthQuarterYear1Membersm:NYMEXHHMember2022-12-312022-12-310000893538sm:NYMEXHHMembersm:GasSwapsContractYear2Member2022-12-312022-12-310000893538sm:NYMEXHHMembersm:GasSwapsContractYear3Member2022-12-312022-12-310000893538sm:NYMEXHHMembersm:GasSwapsContractFirstQuarterYear1Member2022-12-31iso4217:USDsm:EnergyContent0000893538sm:NYMEXHHMembersm:GasSwapsContractSecondQuarterYear1Member2022-12-310000893538sm:GasSwapsContractThirdQuarterYear1Membersm:NYMEXHHMember2022-12-310000893538sm:GasSwapsContractFourthQuarterYear1Membersm:NYMEXHHMember2022-12-310000893538sm:NYMEXHHMembersm:GasSwapsContractYear2Member2022-12-310000893538sm:NYMEXHHMembersm:GasSwapsContractYear3Member2022-12-310000893538sm:IFWAHAMembersm:GasSwapsContractFirstQuarterYear1Member2022-12-312022-12-310000893538sm:GasSwapsContractSecondQuarterYear1Membersm:IFWAHAMember2022-12-312022-12-310000893538sm:GasSwapsContractThirdQuarterYear1Membersm:IFWAHAMember2022-12-312022-12-310000893538sm:GasSwapsContractFourthQuarterYear1Membersm:IFWAHAMember2022-12-312022-12-310000893538sm:IFWAHAMembersm:GasSwapsContractYear2Member2022-12-312022-12-310000893538sm:GasSwapsContractYear3Membersm:IFWAHAMember2022-12-312022-12-310000893538sm:IFWAHAMembersm:GasSwapsContractFirstQuarterYear1Member2022-12-310000893538sm:GasSwapsContractSecondQuarterYear1Membersm:IFWAHAMember2022-12-310000893538sm:GasSwapsContractThirdQuarterYear1Membersm:IFWAHAMember2022-12-310000893538sm:GasSwapsContractFourthQuarterYear1Membersm:IFWAHAMember2022-12-310000893538sm:IFWAHAMembersm:GasSwapsContractYear2Member2022-12-310000893538sm:GasSwapsContractYear3Membersm:IFWAHAMember2022-12-310000893538sm:GasCollarContractFirstQuarterYear1Membersm:NYMEXHHMember2022-12-312022-12-310000893538sm:GasCollarContractSecondQuarterYear1Membersm:NYMEXHHMember2022-12-312022-12-310000893538sm:NYMEXHHMembersm:GasCollarContractThirdQuarterYear1Member2022-12-312022-12-310000893538sm:NYMEXHHMembersm:GasCollarContractFourthQuarterYear1Member2022-12-312022-12-310000893538sm:GasCollarContractYear2Membersm:NYMEXHHMember2022-12-312022-12-310000893538sm:GasCollarContractYear3Membersm:NYMEXHHMember2022-12-312022-12-310000893538sm:GasCollarContractFirstQuarterYear1Membersm:NYMEXHHMember2022-12-310000893538sm:GasCollarContractSecondQuarterYear1Membersm:NYMEXHHMember2022-12-310000893538sm:NYMEXHHMembersm:GasCollarContractThirdQuarterYear1Member2022-12-310000893538sm:NYMEXHHMembersm:GasCollarContractFourthQuarterYear1Member2022-12-310000893538sm:GasCollarContractYear2Membersm:NYMEXHHMember2022-12-310000893538sm:GasCollarContractYear3Membersm:NYMEXHHMember2022-12-310000893538sm:GasCollarContractFirstQuarterYear1Membersm:IfHscMember2022-12-312022-12-310000893538sm:GasCollarContractSecondQuarterYear1Membersm:IfHscMember2022-12-312022-12-310000893538sm:GasCollarContractThirdQuarterYear1Membersm:IfHscMember2022-12-312022-12-310000893538sm:IfHscMembersm:GasCollarContractFourthQuarterYear1Member2022-12-312022-12-310000893538sm:GasCollarContractYear2Membersm:IfHscMember2022-12-312022-12-310000893538sm:GasCollarContractYear3Membersm:IfHscMember2022-12-312022-12-310000893538sm:GasCollarContractFirstQuarterYear1Membersm:IfHscMember2022-12-310000893538sm:GasCollarContractSecondQuarterYear1Membersm:IfHscMember2022-12-310000893538sm:GasCollarContractThirdQuarterYear1Membersm:IfHscMember2022-12-310000893538sm:IfHscMembersm:GasCollarContractFourthQuarterYear1Member2022-12-310000893538sm:GasCollarContractYear2Membersm:IfHscMember2022-12-310000893538sm:GasCollarContractYear3Membersm:IfHscMember2022-12-310000893538sm:GasBasisSwapContractFirstQuarterYear1Membersm:IFWAHANYMEXHHMember2022-12-312022-12-310000893538sm:IFWAHANYMEXHHMembersm:GasBasisSwapContractSecondQuarterYear1Member2022-12-312022-12-310000893538sm:IFWAHANYMEXHHMembersm:GasBasisSwapContractThirdQuarterYear1Member2022-12-312022-12-310000893538sm:IFWAHANYMEXHHMembersm:GasBasisSwapContractFourthQuarterYear1Member2022-12-312022-12-310000893538sm:GasBasisSwapContractYear2Membersm:IFWAHANYMEXHHMember2022-12-312022-12-310000893538sm:IFWAHANYMEXHHMembersm:GasBasisSwapContractYear3Member2022-12-312022-12-310000893538sm:GasBasisSwapContractFirstQuarterYear1Membersm:IFWAHANYMEXHHMember2022-12-310000893538sm:IFWAHANYMEXHHMembersm:GasBasisSwapContractSecondQuarterYear1Member2022-12-310000893538sm:IFWAHANYMEXHHMembersm:GasBasisSwapContractThirdQuarterYear1Member2022-12-310000893538sm:IFWAHANYMEXHHMembersm:GasBasisSwapContractFourthQuarterYear1Member2022-12-310000893538sm:GasBasisSwapContractYear2Membersm:IFWAHANYMEXHHMember2022-12-310000893538sm:IFWAHANYMEXHHMembersm:GasBasisSwapContractYear3Member2022-12-310000893538sm:GasBasisSwapContractFirstQuarterYear1Membersm:IFHSCNYMEXHHMember2022-12-312022-12-310000893538sm:IFHSCNYMEXHHMembersm:GasBasisSwapContractSecondQuarterYear1Member2022-12-312022-12-310000893538sm:IFHSCNYMEXHHMembersm:GasBasisSwapContractThirdQuarterYear1Member2022-12-312022-12-310000893538sm:IFHSCNYMEXHHMembersm:GasBasisSwapContractFourthQuarterYear1Member2022-12-312022-12-310000893538sm:IFHSCNYMEXHHMembersm:GasBasisSwapContractYear2Member2022-12-312022-12-310000893538sm:IFHSCNYMEXHHMembersm:GasBasisSwapContractYear3Member2022-12-312022-12-310000893538sm:GasBasisSwapContractFirstQuarterYear1Membersm:IFHSCNYMEXHHMember2022-12-310000893538sm:IFHSCNYMEXHHMembersm:GasBasisSwapContractSecondQuarterYear1Member2022-12-310000893538sm:IFHSCNYMEXHHMembersm:GasBasisSwapContractThirdQuarterYear1Member2022-12-310000893538sm:IFHSCNYMEXHHMembersm:GasBasisSwapContractFourthQuarterYear1Member2022-12-310000893538sm:IFHSCNYMEXHHMembersm:GasBasisSwapContractYear2Member2022-12-310000893538sm:IFHSCNYMEXHHMembersm:GasBasisSwapContractYear3Member2022-12-310000893538sm:NYMEXOilSwapContractYear1Memberus-gaap:SubsequentEventMember2023-01-012023-02-230000893538sm:NYMEXOilSwapContractYear1Memberus-gaap:SubsequentEventMember2023-02-230000893538sm:WTIMidlandNYMEXWTIMemberus-gaap:SubsequentEventMembersm:OilBasisSwapContractYear2Member2023-01-012023-02-230000893538sm:WTIMidlandNYMEXWTIMemberus-gaap:SubsequentEventMembersm:OilBasisSwapContractYear2Member2023-02-230000893538sm:WTIHoustonMEHNYMEXWTIMemberus-gaap:SubsequentEventMembersm:OilBasisSwapContractYear2Member2023-01-012023-02-230000893538sm:WTIHoustonMEHNYMEXWTIMemberus-gaap:SubsequentEventMembersm:OilBasisSwapContractYear2Member2023-02-230000893538sm:NYMEXOilCalendarMonthAverageRollDifferentialContractYear2Memberus-gaap:SubsequentEventMember2023-01-012023-02-230000893538sm:NYMEXOilCalendarMonthAverageRollDifferentialContractYear2Memberus-gaap:SubsequentEventMember2023-02-230000893538sm:GasCollarContractYear2Membersm:NYMEXHHMemberus-gaap:SubsequentEventMember2023-01-012023-02-230000893538sm:GasCollarContractYear2Membersm:NYMEXHHMemberus-gaap:SubsequentEventMember2023-02-230000893538sm:NGLSwapsContractYear1Membersm:OPISPropaneMontBelvieuNonTETMemberus-gaap:SubsequentEventMember2023-01-012023-02-230000893538sm:NGLSwapsContractYear1Membersm:OPISPropaneMontBelvieuNonTETMemberus-gaap:SubsequentEventMember2023-02-230000893538us-gaap:NondesignatedMember2022-12-310000893538us-gaap:NondesignatedMember2021-12-310000893538us-gaap:DesignatedAsHedgingInstrumentMember2022-12-310000893538us-gaap:DesignatedAsHedgingInstrumentMember2021-12-310000893538us-gaap:DesignatedAsHedgingInstrumentMember2020-12-310000893538sm:OilContractsMember2022-01-012022-12-310000893538sm:OilContractsMember2021-01-012021-12-310000893538sm:OilContractsMember2020-01-012020-12-310000893538sm:GasContractsMember2022-01-012022-12-310000893538sm:GasContractsMember2021-01-012021-12-310000893538sm:GasContractsMember2020-01-012020-12-310000893538sm:NGLContractsMember2022-01-012022-12-310000893538sm:NGLContractsMember2021-01-012021-12-310000893538sm:NGLContractsMember2020-01-012020-12-310000893538us-gaap:NonqualifiedPlanMember2022-12-310000893538us-gaap:NonqualifiedPlanMember2020-12-310000893538us-gaap:NonqualifiedPlanMember2021-12-310000893538us-gaap:NonqualifiedPlanMember2022-01-012022-12-310000893538us-gaap:NonqualifiedPlanMember2021-01-012021-12-310000893538us-gaap:NonqualifiedPlanMember2020-01-012020-12-310000893538us-gaap:DefinedBenefitPlanEquitySecuritiesMember2022-12-310000893538us-gaap:DefinedBenefitPlanEquitySecuritiesMember2021-12-310000893538us-gaap:FixedIncomeSecuritiesMember2022-12-310000893538us-gaap:FixedIncomeSecuritiesMember2021-12-310000893538sm:OtherSecuritiesMember2022-12-310000893538sm:OtherSecuritiesMember2021-12-310000893538us-gaap:DefinedBenefitPlanEquitySecuritiesUsMember2022-12-310000893538us-gaap:FairValueInputsLevel1Memberus-gaap:DefinedBenefitPlanEquitySecuritiesUsMember2022-12-310000893538us-gaap:DefinedBenefitPlanEquitySecuritiesUsMemberus-gaap:FairValueInputsLevel2Member2022-12-310000893538us-gaap:DefinedBenefitPlanEquitySecuritiesUsMemberus-gaap:FairValueInputsLevel3Member2022-12-310000893538us-gaap:DefinedBenefitPlanEquitySecuritiesNonUsMember2022-12-310000893538us-gaap:FairValueInputsLevel1Memberus-gaap:DefinedBenefitPlanEquitySecuritiesNonUsMember2022-12-310000893538us-gaap:FairValueInputsLevel2Memberus-gaap:DefinedBenefitPlanEquitySecuritiesNonUsMember2022-12-310000893538us-gaap:DefinedBenefitPlanEquitySecuritiesNonUsMemberus-gaap:FairValueInputsLevel3Member2022-12-310000893538us-gaap:FairValueInputsLevel1Memberus-gaap:DefinedBenefitPlanEquitySecuritiesMember2022-12-310000893538us-gaap:DefinedBenefitPlanEquitySecuritiesMemberus-gaap:FairValueInputsLevel2Member2022-12-310000893538us-gaap:DefinedBenefitPlanEquitySecuritiesMemberus-gaap:FairValueInputsLevel3Member2022-12-310000893538us-gaap:FixedIncomeInvestmentsMember2022-12-310000893538us-gaap:FairValueInputsLevel1Memberus-gaap:FixedIncomeInvestmentsMember2022-12-310000893538us-gaap:FairValueInputsLevel2Memberus-gaap:FixedIncomeInvestmentsMember2022-12-310000893538us-gaap:FixedIncomeInvestmentsMemberus-gaap:FairValueInputsLevel3Member2022-12-310000893538us-gaap:CorporateDebtSecuritiesMember2022-12-310000893538us-gaap:FairValueInputsLevel1Memberus-gaap:CorporateDebtSecuritiesMember2022-12-310000893538us-gaap:CorporateDebtSecuritiesMemberus-gaap:FairValueInputsLevel2Member2022-12-310000893538us-gaap:CorporateDebtSecuritiesMemberus-gaap:FairValueInputsLevel3Member2022-12-310000893538us-gaap:FixedIncomeSecuritiesMemberus-gaap:FairValueInputsLevel1Member2022-12-310000893538us-gaap:FixedIncomeSecuritiesMemberus-gaap:FairValueInputsLevel2Member2022-12-310000893538us-gaap:FixedIncomeSecuritiesMemberus-gaap:FairValueInputsLevel3Member2022-12-310000893538us-gaap:DefinedBenefitPlanRealEstateMember2022-12-310000893538us-gaap:FairValueInputsLevel1Memberus-gaap:DefinedBenefitPlanRealEstateMember2022-12-310000893538us-gaap:DefinedBenefitPlanRealEstateMemberus-gaap:FairValueInputsLevel2Member2022-12-310000893538us-gaap:DefinedBenefitPlanRealEstateMemberus-gaap:FairValueInputsLevel3Member2022-12-310000893538us-gaap:DefinedBenefitPlanCommonCollectiveTrustMember2022-12-310000893538us-gaap:FairValueInputsLevel1Memberus-gaap:DefinedBenefitPlanCommonCollectiveTrustMember2022-12-310000893538us-gaap:DefinedBenefitPlanCommonCollectiveTrustMemberus-gaap:FairValueInputsLevel2Member2022-12-310000893538us-gaap:DefinedBenefitPlanCommonCollectiveTrustMemberus-gaap:FairValueInputsLevel3Member2022-12-310000893538us-gaap:HedgeFundsMember2022-12-310000893538us-gaap:HedgeFundsMemberus-gaap:FairValueInputsLevel1Member2022-12-310000893538us-gaap:HedgeFundsMemberus-gaap:FairValueInputsLevel2Member2022-12-310000893538us-gaap:HedgeFundsMemberus-gaap:FairValueInputsLevel3Member2022-12-310000893538sm:OtherSecuritiesMemberus-gaap:FairValueInputsLevel1Member2022-12-310000893538sm:OtherSecuritiesMemberus-gaap:FairValueInputsLevel2Member2022-12-310000893538sm:OtherSecuritiesMemberus-gaap:FairValueInputsLevel3Member2022-12-310000893538us-gaap:FairValueInputsLevel1Member2022-12-310000893538us-gaap:FairValueInputsLevel2Member2022-12-310000893538us-gaap:FairValueInputsLevel3Member2022-12-310000893538us-gaap:DefinedBenefitPlanEquitySecuritiesUsMember2021-12-310000893538us-gaap:FairValueInputsLevel1Memberus-gaap:DefinedBenefitPlanEquitySecuritiesUsMember2021-12-310000893538us-gaap:DefinedBenefitPlanEquitySecuritiesUsMemberus-gaap:FairValueInputsLevel2Member2021-12-310000893538us-gaap:DefinedBenefitPlanEquitySecuritiesUsMemberus-gaap:FairValueInputsLevel3Member2021-12-310000893538us-gaap:DefinedBenefitPlanEquitySecuritiesNonUsMember2021-12-310000893538us-gaap:FairValueInputsLevel1Memberus-gaap:DefinedBenefitPlanEquitySecuritiesNonUsMember2021-12-310000893538us-gaap:FairValueInputsLevel2Memberus-gaap:DefinedBenefitPlanEquitySecuritiesNonUsMember2021-12-310000893538us-gaap:DefinedBenefitPlanEquitySecuritiesNonUsMemberus-gaap:FairValueInputsLevel3Member2021-12-310000893538us-gaap:FairValueInputsLevel1Memberus-gaap:DefinedBenefitPlanEquitySecuritiesMember2021-12-310000893538us-gaap:DefinedBenefitPlanEquitySecuritiesMemberus-gaap:FairValueInputsLevel2Member2021-12-310000893538us-gaap:DefinedBenefitPlanEquitySecuritiesMemberus-gaap:FairValueInputsLevel3Member2021-12-310000893538us-gaap:FixedIncomeInvestmentsMember2021-12-310000893538us-gaap:FairValueInputsLevel1Memberus-gaap:FixedIncomeInvestmentsMember2021-12-310000893538us-gaap:FairValueInputsLevel2Memberus-gaap:FixedIncomeInvestmentsMember2021-12-310000893538us-gaap:FixedIncomeInvestmentsMemberus-gaap:FairValueInputsLevel3Member2021-12-310000893538us-gaap:CorporateDebtSecuritiesMember2021-12-310000893538us-gaap:FairValueInputsLevel1Memberus-gaap:CorporateDebtSecuritiesMember2021-12-310000893538us-gaap:CorporateDebtSecuritiesMemberus-gaap:FairValueInputsLevel2Member2021-12-310000893538us-gaap:CorporateDebtSecuritiesMemberus-gaap:FairValueInputsLevel3Member2021-12-310000893538us-gaap:FixedIncomeSecuritiesMemberus-gaap:FairValueInputsLevel1Member2021-12-310000893538us-gaap:FixedIncomeSecuritiesMemberus-gaap:FairValueInputsLevel2Member2021-12-310000893538us-gaap:FixedIncomeSecuritiesMemberus-gaap:FairValueInputsLevel3Member2021-12-310000893538us-gaap:DefinedBenefitPlanRealEstateMember2021-12-310000893538us-gaap:FairValueInputsLevel1Memberus-gaap:DefinedBenefitPlanRealEstateMember2021-12-310000893538us-gaap:DefinedBenefitPlanRealEstateMemberus-gaap:FairValueInputsLevel2Member2021-12-310000893538us-gaap:DefinedBenefitPlanRealEstateMemberus-gaap:FairValueInputsLevel3Member2021-12-310000893538us-gaap:DefinedBenefitPlanCommonCollectiveTrustMember2021-12-310000893538us-gaap:FairValueInputsLevel1Memberus-gaap:DefinedBenefitPlanCommonCollectiveTrustMember2021-12-310000893538us-gaap:DefinedBenefitPlanCommonCollectiveTrustMemberus-gaap:FairValueInputsLevel2Member2021-12-310000893538us-gaap:DefinedBenefitPlanCommonCollectiveTrustMemberus-gaap:FairValueInputsLevel3Member2021-12-310000893538us-gaap:HedgeFundsMember2021-12-310000893538us-gaap:HedgeFundsMemberus-gaap:FairValueInputsLevel1Member2021-12-310000893538us-gaap:HedgeFundsMemberus-gaap:FairValueInputsLevel2Member2021-12-310000893538us-gaap:HedgeFundsMemberus-gaap:FairValueInputsLevel3Member2021-12-310000893538sm:OtherSecuritiesMemberus-gaap:FairValueInputsLevel1Member2021-12-310000893538sm:OtherSecuritiesMemberus-gaap:FairValueInputsLevel2Member2021-12-310000893538sm:OtherSecuritiesMemberus-gaap:FairValueInputsLevel3Member2021-12-310000893538us-gaap:FairValueInputsLevel1Member2021-12-310000893538us-gaap:FairValueInputsLevel2Member2021-12-310000893538us-gaap:FairValueInputsLevel3Member2021-12-310000893538us-gaap:FairValueInputsLevel3Member2020-12-310000893538us-gaap:FairValueInputsLevel3Member2021-01-012021-12-310000893538us-gaap:FairValueInputsLevel3Member2022-01-012022-12-310000893538sm:DueFromJointInterestOwnersMember2022-12-310000893538sm:DueFromJointInterestOwnersMember2021-12-310000893538sm:OtherReceivablesMember2022-12-310000893538sm:OtherReceivablesMember2021-12-31
UNITED STATES
SECURITIES AND EXCHANGE COMMISSION
Washington, D.C. 20549
FORM 10-K
☑ Annual Report Pursuant to Section 13 or 15(d) of the Securities Exchange Act of 1934
For the fiscal year ended December 31, 2022
or
☐ Transition Report Pursuant to Section 13 or 15(d) of the Securities Exchange Act of 1934
Commission file number 001-31539
SM ENERGY COMPANY
(Exact name of registrant as specified in its charter)
| | | | | | | | | | | | | | |
| Delaware | | 41-0518430 | |
| (State or other jurisdiction of incorporation or organization) | | (I.R.S. Employer Identification No.) | |
| | | | | | | | | | | | | | |
| 1700 Lincoln Street, Suite 3200, Denver, Colorado | | 80203 | |
| (Address of principal executive offices) | | (Zip Code) | |
(303) 861-8140
(Registrant’s telephone number, including area code)
Securities registered pursuant to Section 12(b) of the Act:
| | | | | | | | |
| Title of each class | Trading Symbol(s) | Name of each exchange on which registered |
| Common stock, $0.01 par value | SM | New York Stock Exchange |
Securities registered pursuant to Section 12(g) of the Act: None
Indicate by check mark if the registrant is a well-known seasoned issuer, as defined in Rule 405 of the Securities Act. Yes ☑ No ☐
Indicate by check mark if the registrant is not required to file reports pursuant to Section 13 or Section 15(d) of the Act. Yes ☐ No ☑
Indicate by check mark whether the registrant (1) has filed all reports required to be filed by Section 13 or 15(d) of the Securities Exchange Act of 1934 during the preceding 12 months (or for such shorter period that the registrant was required to file such reports), and (2) has been subject to such filing requirements for the past 90 days. Yes ☑ No ☐
Indicate by check mark whether the registrant has submitted electronically every Interactive Data File required to be submitted pursuant to Rule 405 of Regulation S-T (§232.405 of this chapter) during the preceding 12 months (or for such shorter period that the registrant was required to submit such files). Yes ☑ No ☐
Indicate by check mark whether the registrant is a large accelerated filer, an accelerated filer, a non-accelerated filer, a smaller reporting company, or emerging growth company. See the definitions of “large accelerated filer,” “accelerated filer,” “smaller reporting company,” and “emerging growth company” in Rule 12b-2 of the Exchange Act.
| | | | | | | | | | | | | | | | | | | | |
| Large accelerated filer | ☑ | | Accelerated filer | ☐ | |
| | | | | | |
| Non-accelerated filer | ☐ | | Smaller reporting company | ☐ | |
| | | | | | |
| | | | Emerging growth company | ☐ | |
| | | | | | |
If an emerging growth company, indicate by check mark if the registrant has elected not to use the extended transition period for complying with any new or revised financial accounting standards provided pursuant to Section 13(a) of the Exchange Act. ☐ |
Indicate by check mark whether the registrant has filed a report on and attestation to its management’s assessment of the effectiveness of its internal control over financial reporting under Section 404(b) of the Sarbanes-Oxley Act (15 U.S.C.7262(b)) by the registered public accounting firm that prepared or issued its audit report. ☑
If securities are registered pursuant to section 12(b) of the Act, indicate by check mark whether the financial statements of the registrant included in the filing reflect the correction of an error to previously issued financial statements. ☐
Indicate by check mark whether any of those error corrections are restatements that required a recovery analysis of incentive-based compensation received by any of the registrant’s executive officers during the relevant recovery period pursuant to §240.10D-1(b). ☐
Indicate by check mark whether the registrant is a shell company (as defined in Rule 12b-2 of the Act). Yes ☐ No ☑
The aggregate market value of the 120,301,526 shares of voting stock held by non-affiliates of the registrant, based upon the closing sale price of the registrant’s common stock on June 30, 2022, the last business day of the registrant’s most recently completed second fiscal quarter, of $34.19 per share, as reported on the New York Stock Exchange, was $4,113,109,174. Shares of common stock held by each director and executive officer and by each person who owns 10 percent or more of the outstanding common stock or who is otherwise believed by the registrant to be in a control position have been excluded. This determination of affiliate status is not necessarily a conclusive determination for other purposes.
As of February 9, 2023, the registrant had 121,931,676 shares of common stock outstanding.
DOCUMENTS INCORPORATED BY REFERENCE
Certain information required by Items 10, 11, 12, 13, and 14 of Part III of this report is incorporated by reference from portions of the registrant’s Definitive Proxy Statement on Schedule 14A relating to its 2023 annual meeting of stockholders, to be filed within 120 days after December 31, 2022.
| | | | | | | | |
| TABLE OF CONTENTS |
| Item | | Page |
| | |
| | |
| | |
| | |
| | |
| | |
| | |
| | |
| | |
| | |
| | |
| | |
| | |
| | |
| | |
| | |
| | |
| | |
| | |
| | |
| | |
| | |
| | |
| | |
| | |
| | |
| | |
| | |
| | |
| | |
| | |
| | |
| | |
| | |
| | |
| | |
| | |
| | |
| | |
| | |
| | |
| | |
| | |
| | |
| | | | | | | | |
| TABLE OF CONTENTS |
| (Continued) |
| Item | | Page |
| | |
| | |
| | |
| | |
| | |
| | |
| | |
| | |
| | |
| | |
Cautionary Information about Forward-Looking Statements
This Annual Report on Form 10-K (“Form 10-K” or “this report”) contains “forward-looking statements” within the meaning of Section 27A of the Securities Act of 1933, as amended (“Securities Act”), and Section 21E of the Securities Exchange Act of 1934, as amended (“Exchange Act”). All statements included in this report, other than statements of historical facts, that address activities, conditions, events, or developments with respect to our financial condition, results of operations, business prospects or economic performance that we expect, believe, or anticipate will or may occur in the future, or that address plans and objectives of management for future operations, are forward-looking statements. The words “anticipate,” “assume,” “believe,” “budget,” “could,” “estimate,” “expect,” “forecast,” “goal,” “intend,” “pending,” “plan,” “potential,” “projected,” “target,” “will,” and similar expressions are intended to identify forward-looking statements. Forward-looking statements appear throughout this report, and include statements about such matters as:
•business strategies and other plans and objectives for future operations, including plans for expansion and growth of operations or to defer capital investment, plans with respect to future dividend payments, debt redemptions or equity repurchases, capital markets activities, environmental, social, and governance (“ESG”) goals and initiatives, and our outlook on our future financial condition or results of operations;
•the amount and nature of future capital expenditures, the resilience of our assets to declining commodity prices, and the availability of liquidity and capital resources to fund capital expenditures;
•our outlook on prices for future crude oil, natural gas, and natural gas liquids (also referred to throughout this report as “oil,” “gas,” and “NGLs,” respectively), well costs, service costs, production costs, and general and administrative costs, and the impacts of inflation on each of these;
•armed conflict, political instability, or civil unrest in oil and gas producing regions, including the ongoing conflict between Russia and Ukraine, and related potential effects on laws and regulations, or the imposition of economic or trade sanctions;
•any changes to the borrowing base or aggregate lender commitments under our Seventh Amended and Restated Credit Agreement (“Credit Agreement”);
•cash flows, liquidity, interest and related debt service expenses, changes in our effective tax rate, and our ability to repay debt in the future;
•our drilling and completion activities and other exploration and development activities, each of which could be impacted by supply chain disruptions and inflation, our ability to obtain permits and governmental approvals, and plans by us, our joint development partners, and/or other third-party operators;
•the effects of the global COVID-19 pandemic (“Pandemic”) on us, our industry, our financial condition, and our results of operations;
•possible or expected acquisitions and divestitures, including the possible divestiture or farm-out of, or farm-in or joint development of, certain properties;
•oil, gas, and NGL reserve estimates and estimates of both future net revenues and the present value of future net revenues associated with those reserve estimates, as well as the conversion of proved undeveloped reserves to proved developed reserves;
•our expected future production volumes, identified drilling locations, as well as drilling prospects, inventories, projects and programs; and
•other similar matters, such as those discussed in Management’s Discussion and Analysis of Financial Condition and Results of Operations in Part II, Item 7 of this report.
Our forward-looking statements are based on assumptions and analyses made by us in light of our experience and our perception of historical trends, current conditions, expected future developments, and other factors that we believe are appropriate under the circumstances. We caution you that forward-looking statements are not guarantees of future performance and these statements are subject to known and unknown risks and uncertainties, which may cause our actual results or performance to be materially different from any future results or performance expressed or implied by the forward-looking statements. Factors that may cause our financial condition, results of operations, business prospects or economic performance to differ from expectations include the factors discussed in Part I, Item 1A, Risk Factors below and elsewhere in this report.
The forward-looking statements in this report speak only as of the filing of this report. Although we may from time to time voluntarily update our prior forward-looking statements, we disclaim any commitment to do so except as required by applicable securities laws.
Glossary
The oil and gas terms and other terms defined in this section are used throughout this report. The definitions of the terms “developed reserves,” “exploratory well,” “field,” “proved reserves,” and “undeveloped reserves” have been abbreviated from the respective definitions under Rule 4-10(a) of Regulation S-X. The entire definitions of those terms under Rule 4-10(a) of Regulation S-X can be located through the Securities and Exchange Commission’s (“SEC”) website at www.sec.gov.
Ad valorem tax. A tax based on the value of real estate or personal property.
ASC. Accounting Standards Codification.
ASU. Accounting Standards Update.
Bbl. One stock tank barrel, or 42 U.S. gallons liquid volume, used in reference to oil, NGLs, water, or other liquid hydrocarbons.
BBtu. One billion British thermal units.
Bcf. One billion cubic feet, used in reference to gas.
BOE. Barrels of oil equivalent. Oil equivalents are determined using the ratio of six Mcf of gas to one Bbl of oil or NGLs.
Btu. One British thermal unit, the quantity of heat required to raise the temperature of a one-pound mass of water by one degree Fahrenheit.
Completion. The installation of equipment for production of oil, gas, and/or NGLs, or in the case of a dry hole, the reporting to the applicable authority that the well has been abandoned.
Conversion rate. Current year conversions of proved undeveloped reserves to proved developed reserves, divided by beginning of the year proved undeveloped reserves (also commonly referred to in our industry as “track record”).
Costs incurred. Costs incurred in oil and gas property acquisition, exploration, and development activities, whether capitalized or expensed.
Developed acreage. The number of acres that are allocated or assignable to productive wells or wells capable of production.
Developed reserves. Reserves that can be expected to be recovered: (i) through existing wells with existing equipment and operating methods or in which the cost of the required equipment is relatively minor compared to the cost of a new well; and (ii) through installed extraction equipment and infrastructure operational at the time of the reserves estimate if the extraction is by means not involving a well.
Development well. A well drilled within the proved area of an oil or gas reservoir to the depth of a stratigraphic horizon known to be productive.
Dry hole. An exploratory, development, or extension well that proves to be incapable of producing oil, gas, and/or NGLs in sufficient commercial quantities to justify completion, or upon completion, the economic operation of a well (also referred to as “non-productive well”).
Exploratory well. A well drilled to find a new field or to find a new reservoir in a field previously found to be productive of oil or gas in another reservoir.
FASB. Financial Accounting Standards Board.
Fee properties. The most extensive interest that can be owned in land, including surface and mineral (including oil and gas) rights.
Field. An area consisting of a single reservoir or multiple reservoirs all grouped on or related to the same individual geological structural feature and/or stratigraphic condition.
Formation. A succession of sedimentary beds that were deposited under the same general geologic conditions.
GAAP. Accounting principles generally accepted in the United States.
Gross acres or gross wells. Acres or wells in which a working interest is owned.
Horizontal wells. Wells that are drilled at angles greater than 70 degrees from vertical.
Lease operating expenses (“LOE”). The expenses incurred in the lifting of oil, gas, and/or NGLs from a producing formation to the surface, constituting part of the current operating expenses of a working interest, and also including labor, superintendence, supplies, repairs, maintenance, allocated overhead costs, and other expenses incidental to production, but not including lease acquisition, drilling, or completion costs.
MBbl. One thousand barrels, used in reference to oil, NGLs, water, or other liquid hydrocarbons.
MBOE. One thousand barrels of oil equivalent.
Mcf. One thousand cubic feet, used in reference to gas.
MMBbl. One million barrels, used in reference to oil, NGLs, water, or other liquid hydrocarbons.
MMBOE. One million barrels of oil equivalent.
MMBtu. One million British thermal units.
MMcf. One million cubic feet, used in reference to gas.
Net acres or net wells. Sum of our fractional working interests owned in gross acres or gross wells.
NGLs. The combination of ethane, propane, isobutane, normal butane, and natural gasoline that when removed from gas become liquid under various levels of higher pressure and lower temperature.
NYMEX WTI. New York Mercantile Exchange West Texas Intermediate, a common industry benchmark price for oil.
NYMEX Henry Hub. New York Mercantile Exchange Henry Hub, a common industry benchmark price for gas.
OPEC+. The Organization of the Petroleum Exporting Countries (“OPEC”) plus other non-OPEC oil producing countries.
OPIS. Oil Price Information Service, a common industry benchmark for NGL pricing at Mont Belvieu, Texas.
PV-10. PV-10 is a non-GAAP measure. The present value of estimated future revenue to be generated from the production of estimated net proved reserves, net of estimated production and future development costs, based on prices used in estimating the proved reserves and costs in effect as of the date indicated (unless such costs are subject to change pursuant to contractual provisions), without giving effect to non-property related expenses such as general and administrative expenses, debt service, future income tax expenses, or depreciation, depletion, and amortization, discounted using an annual discount rate of 10 percent. While this measure does not include the effect of income taxes as it would in the use of the standardized measure of discounted future net cash flows calculation, it does provide an indicative representation of the relative value of the Company on a comparative basis to other companies and from period to period. This measure is presented because management believes it provides useful information to investors for analysis of the Company's fundamental business on a recurring basis.
Productive well. An exploratory, development, or extension well that is producing or is capable of commercial production of oil, gas, and/or NGLs.
Proved reserves. Those quantities of oil, gas, and NGLs which, by analysis of geoscience and engineering data, can be estimated with reasonable certainty to be economically producible from a given date forward, from known reservoirs, and under existing economic conditions, operating methods, and government regulations prior to the time at which contracts providing the right to operate expire, unless evidence indicates that renewal is reasonably certain, regardless of whether deterministic or probabilistic methods are used for the estimation. Existing economic conditions include prices and costs at which economic producibility from a reservoir is to be determined, and the price to be used is the average price during the 12-month period prior to the ending date of the period covered by the report, determined as an unweighted arithmetic average of the first-day-of-the-month price for each month within such period, unless prices are defined by contractual arrangements, excluding escalations based upon future conditions.
Recompletion. The completion of an existing wellbore in a formation other than that in which the well has previously been completed.
Reserve life index. Expressed in years, represents the estimated net proved reserves at a specified date divided by actual production for the preceding 12-month period.
Reservoir. A porous and permeable underground formation containing a natural accumulation of producible oil, gas, and/or associated liquid resources that is confined by impermeable rock or water barriers and is individual and separate from other reservoirs.
Resource play. A term used to describe an accumulation of oil, gas, and/or associated liquid resources known to exist over a large areal expanse, which when compared to a conventional play typically has lower expected geological risk.
Royalty. The amount or fee paid to the owner of mineral rights, expressed as a percentage or fraction of gross income from oil, gas, and NGLs produced and sold unencumbered by expenses relating to the drilling, completing, and operating of the affected well.
Royalty interest. An interest in an oil and gas property entitling the owner to shares of oil, gas, and NGL production free of costs of exploration, development, and production operations.
Seismic. The sending of energy waves or sound waves into the earth and analyzing the wave reflections to infer the type, size, shape, and depth of subsurface rock formations.
Shale. Fine-grained sedimentary rock composed mostly of consolidated clay or mud. Shale is the most frequently occurring sedimentary rock.
SOFR. Secured Overnight Financing Rate.
Standardized measure of discounted future net cash flows. The discounted future net cash flows related to estimated proved reserves based on prices used in estimating the reserves, year-end costs, and statutory tax rates, at a 10 percent annual discount rate. The information for this calculation is included in Supplemental Oil and Gas Information (unaudited) located in Part II, Item 8 of this report.
Undeveloped acreage. Lease acreage on which wells have not been drilled or completed to a point that would permit the production of commercial quantities of oil, gas, and NGLs regardless of whether such acreage contains estimated net proved reserves.
Undeveloped reserves. Reserves that are expected to be recovered from new wells on undrilled acreage, or from existing wells where a relatively major expenditure is required for recompletion. The applicable SEC definition of undeveloped reserves provides that undrilled locations can be classified as having undeveloped reserves only if a development plan has been adopted indicating that they are scheduled to be drilled within five years, unless the specific circumstances justify a longer time.
Working interest. The operating interest that gives the owner the right to drill, produce, and conduct operating activities on the property and to share in the production, sales, and costs.
PART I
When we use the terms “SM Energy,” the “Company,” “we,” “us,” or “our,” we are referring to SM Energy Company and its subsidiaries unless the context otherwise requires. We have included certain technical terms important to an understanding of our business in the Glossary section of this report. Throughout this document we make statements and projections that address future expectations, possibilities, or events, all of which may be classified as “forward-looking statements.” Please refer to the Cautionary Information about Forward-Looking Statements section of this report for an explanation of these types of statements and the associated risks and uncertainties.
ITEMS 1. AND 2. BUSINESS AND PROPERTIES
General
We are an independent energy company currently engaged in the acquisition, exploration, development, and production of oil, gas, and NGLs in the state of Texas. SM Energy was founded in 1908, incorporated in Delaware in 1915, and our initial public offering of common stock was in December 1992. Our common stock trades on the New York Stock Exchange under the ticker symbol “SM.”
Our principal office is located at 1700 Lincoln Street, Suite 3200, Denver, Colorado 80203, and our telephone number is (303) 861-8140.
Strategy
Our strategy is to be a premier operator of top-tier oil and gas assets. Our team executes this strategy by prioritizing safety, technological innovation, and stewardship of natural resources, all of which are integral to our corporate culture. Our purpose is to make people’s lives better by responsibly producing energy supplies, contributing to domestic energy security and prosperity, and having a positive impact in the communities where we live and work. Our long-term vision is to sustainably grow value for all of our stakeholders by maintaining and optimizing our high-quality asset portfolio, generating cash flows, and maintaining a strong balance sheet. Our near-term goals include returning value to stockholders through our Stock Repurchase Program and fixed dividend payments, which increased during 2022, as discussed in Significant Developments in 2022 below. Our asset portfolio is comprised of high-quality assets in the Midland Basin of West Texas and in the Maverick Basin of South Texas that present resilience to commodity price risk. We intend to achieve our goals by focusing on developing high-quality economic drilling, completion, and production opportunities, while efficiently employing capital and continuing to use innovative technologies.
We are committed to exceptional safety, health, and environmental stewardship; supporting the professional development of a diverse and thriving team of employees; building and maintaining partnerships with our stakeholders by investing in and connecting with the communities where we live and work; and transparency in reporting our progress in these areas. We have prioritized ESG initiatives by, among other things, integrating enhanced environmental and social programs throughout the organization and setting goals that include reducing flaring and greenhouse gas (“GHG” or “GHGs”) emissions intensity, and maintaining low methane emissions intensity. Additionally, we are implementing systems to track additional ESG metrics to improve future reporting and performance, and to increase employee awareness. The Environmental, Social and Governance Committee of our Board of Directors oversees, among other things, the development and implementation of the Company’s ESG policies, programs and initiatives, and, together with management, reports to our Board of Directors regarding such matters. Further demonstrating our commitment to sustainable operations and environmental stewardship, compensation for our executives and eligible employees under our long-term incentive plan, and compensation for all employees under our short-term incentive plan is calculated based on, in part, certain Company-wide, performance-based metrics that include key financial, operational, and environmental, health, and safety measures.
Significant Developments in 2022
During 2022, we accomplished the near-term goals that we established at the beginning of the year. As a result of strong production and increased realized prices before the effect of derivative settlements (“realized price” or “realized prices”), we successfully increased our net cash provided by operating activities allowing us to reduce the principal balance of our outstanding long-term debt earlier than expected, and increased the value of our capital project inventory. Upon the achievement of these short-term goals, we initiated a return of capital program.
Production, Pricing and Revenue, and Commodity Derivatives. Our average net daily equivalent production in 2022 increased three percent compared with 2021 to 145.1 MBOE, consisting of 65.7 MBbl of oil, 345.0 MMcf of gas, and 21.9 MBbl of NGLs. This increase was a result of an increase in capital allocation to our Austin Chalk assets, which resulted in a 37 percent increase in average net daily equivalent production from our South Texas assets, which outpaced a 14 percent decrease in average net daily equivalent production from our Midland Basin assets. As a result, oil production as a percentage of total production decreased to 45 percent in 2022 from 54 percent in 2021.
Realized prices for oil, gas, and NGLs increased 40 percent, 29 percent, and six percent, respectively, for the year ended December 31, 2022, compared with 2021. As a result of increased realized prices, oil, gas, and NGL production revenue increased 29
percent to $3.3 billion for the year ended December 31, 2022, compared with $2.6 billion for 2021. Oil production revenue was 68 percent and 73 percent of total production revenue for the years ended December 31, 2022, and 2021, respectively.
We recorded net derivative losses of $374.0 million and $901.7 million for the years ended December 31, 2022, and 2021, respectively. These amounts include derivative settlement losses of $710.7 million and $749.0 million for the years ended December 31, 2022, and 2021, respectively. Please refer to Areas of Operation below and Overview of the Company in Part II, Item 7 of this report for additional discussion.
Cash Flows and Debt Reduction. For the year ended December 31, 2022, net cash provided by operating activities was $1.7 billion, which was in excess of net cash used in investing activities of $880.3 million. We used the excess of net cash provided by operating activities over net cash used in investing activities to redeem the remaining outstanding aggregate principal balance of our 2024 Senior Notes and 2025 Senior Secured Notes, reducing our total outstanding long-term debt to $1.6 billion as of December 31, 2022, from $2.1 billion as of December 31, 2021, and to return capital to our stockholders, as discussed below. Additionally, as of December 31, 2022, we had a cash and cash equivalents balance of $445.0 million. Please refer to Analysis of Cash Flow Changes Between 2022 and 2021 and Between 2021 and 2020 in Overview of Liquidity and Capital Resources in Part II, Item 7, and to Note 5 – Long-Term Debt in Part II, Item 8 of this report for additional discussion, including the definitions of our 2024 Senior Notes and 2025 Senior Secured Notes.
Return of Capital Program. On September 7, 2022, we announced that our Board of Directors approved a stock repurchase program authorizing us to repurchase up to $500.0 million in aggregate value of our common stock through December 31, 2024 (“Stock Repurchase Program”). During 2022, we repurchased and subsequently retired 1,365,255 shares of our common stock for a total cost of $57.2 million. The Board of Directors also approved an increase to our fixed dividend to $0.60 per share annually, to be paid in quarterly increments of $0.15 per share. During the year ended December 31, 2022, we declared dividends of $0.31 per share which was an increase from $0.02 per share declared during the year ended December 31, 2021. Please refer to Note 3 - Equity in Part II, Item 8 of this report for additional discussion.
Reserves and Capital Investment. Total estimated proved reserves were 537.4 MMBOE as of December 31, 2022, which was an increase of nine percent from 492.0 MMBOE as of December 31, 2021. This increase primarily consisted of revisions of previous estimates of 103.2 MMBOE related to infill reserves in both our South Texas and Midland Basin assets, partially offset by 53.0 MMBOE of production during 2022. Our proved reserve life index increased to 10.1 years as of December 31, 2022, compared with 9.6 years as of December 31, 2021. Please refer to Areas of Operation and Reserves below for additional discussion regarding additions from extensions and discoveries, the removal of certain proved undeveloped reserve cases that are no longer within our development plan over the next five years, and revisions of previous estimates due to infill, price, and performance revisions. Costs incurred increased 34 percent from 2021 to $961.7 million in 2022. Please refer to Areas of Operation below, and to Supplemental Oil and Gas Information (unaudited) in Part II, Item 8 of this report for additional discussion.
Outlook
Our long-term vision to sustainably grow value for all of our stakeholders includes our goal of continuing to generate cash flows in order to return capital to stockholders through our Stock Repurchase Program and fixed dividend. Additionally, we are focused on increasing the value of our capital project inventory through exploration and development optimization and pursuing high-quality economic drilling, completion, and production opportunities.
Our total 2023 capital program, which we expect to fund with cash flows from operations, is expected to be approximately $1.1 billion. We plan to focus our 2023 capital program on highly economic oil development projects in both our Midland Basin and South Texas assets. We expect to repurchase additional shares of our outstanding common stock through our Stock Repurchase Program during 2023, under which $442.8 million remained available for repurchases as of December 31, 2022.
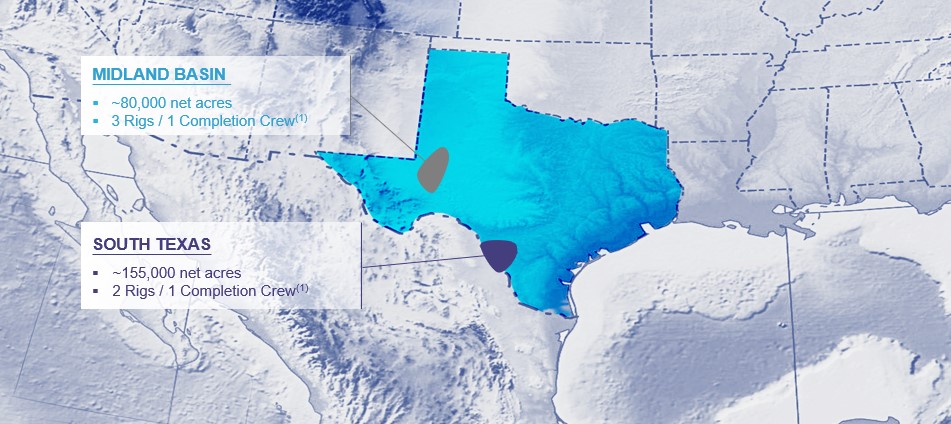
Areas of Operation
____________________________________________
(1)As of December 31, 2022.
Our 2022 operations were concentrated in the Midland Basin and South Texas, as described below. The following table summarizes estimated proved reserves, net production volumes, and costs incurred for the year ended December 31, 2022, for these areas:
| | | | | | | | | | | | | | | | | |
| Midland Basin | | South Texas | | Total (1) |
| Proved reserves | | | | | |
| Oil (MMBbl) | 153.1 | | | 52.7 | | | 205.8 | |
| Gas (Bcf) | 625.1 | | | 777.8 | | | 1,402.9 | |
| NGLs (MMBbl) | 0.2 | | | 97.6 | | | 97.8 | |
MMBOE (1) | 257.4 | | | 280.0 | | | 537.4 | |
Relative percentage | 48 | % | | 52 | % | | 100 | % |
| Proved developed % | 64 | % | | 55 | % | | 59 | % |
| Net production volumes | | | | | |
| Oil (MMBbl) | 19.1 | | | 4.9 | | | 24.0 | |
| Gas (Bcf) | 63.5 | | | 62.5 | | | 125.9 | |
| NGLs (MMBbl) | — | | | 8.0 | | | 8.0 | |
MMBOE (1) | 29.7 | | | 23.2 | | | 53.0 | |
Avg. daily equivalents (MBOE/d) (1) | 81.4 | | | 63.7 | | | 145.1 | |
Relative percentage | 56 | % | | 44 | % | | 100 | % |
Costs incurred (in millions) (2) | $ | 476.2 | | | $ | 431.0 | | | $ | 961.7 | |
___________________________________________
(1)Amounts may not calculate due to rounding.
(2)Asset costs incurred do not sum to total costs incurred primarily due to corporate charges incurred on exploration activities and costs related to exploration efforts outside of our core areas of operation that are excluded from this table. For total costs incurred, please refer to Costs Incurred in Supplemental Oil and Gas Information (unaudited) in Part II, Item 8 of this report.
Total estimated proved reserves at December 31, 2022, increased nine percent from December 31, 2021. Total net equivalent production increased three percent for the year ended December 31, 2022, compared with 2021. Costs incurred for the year ended December 31, 2022, increased 34 percent compared with 2021, primarily as a result of inflation and an increase in capital activity related to the development of our South Texas assets.
Midland Basin. Our Midland Basin assets, which are located in the Permian Basin in West Texas, are comprised of approximately 80,000 net acres, and include our RockStar assets in Howard and Martin Counties, Texas and our Sweetie Peck assets in Upton and Midland Counties, Texas (“Midland Basin”). In 2022, drilling and completion activities within our RockStar and Sweetie Peck positions continued to focus primarily on development optimization and further delineating our Midland Basin position. Our current Midland Basin position provides substantial future development opportunities within multiple oil-rich intervals, including the Spraberry and Wolfcamp formations. We expect 2023 capital activity in the Midland Basin to be focused on highly economic oil development projects.
In 2022, costs incurred were $476.2 million, and we averaged three drilling rigs and one completion crew. We drilled 63 gross (50 net) wells and completed 44 gross (36 net) wells, and as of December 31, 2022, 49 gross (40 net) wells had been drilled but not completed in our operated Midland Basin program. Net equivalent production for the year ended December 31, 2022, was 29.7 MMBOE, a 14 percent decrease from 34.4 MMBOE for the year ended December 31, 2021. Estimated proved reserves increased two percent to 257.4 MMBOE at December 31, 2022, from 251.6 MMBOE at December 31, 2021, as a result of positive price, performance, and infill revisions of 41.0 MMBOE and additions of 5.6 MMBOE, partially offset by production of 29.7 MMBOE. Additionally, we removed 11.1 MMBOE of proved undeveloped reserves which were replaced by recognizing additions to proved undeveloped reserves associated with different locations that were added to our five-year development plan. Infill revisions and additions replaced converted proved undeveloped reserves.
South Texas. Our South Texas assets are comprised of approximately 155,000 net acres located in Dimmit and Webb Counties, Texas (“South Texas”). In 2022, our operations in South Texas were focused on production from the Eagle Ford shale formation and Austin Chalk formation, and further development of the Austin Chalk formation. Our overlapping acreage position in the Maverick Basin covers a significant portion of the western Eagle Ford shale and Austin Chalk formations (“Maverick Basin”) and includes acreage across the oil, gas-condensate, and dry gas windows with gas composition amenable to processing for NGL extraction. We expect 2023 capital activity in South Texas to be focused primarily on developing the Austin Chalk formation.
In 2022, costs incurred were $431.0 million, and we averaged two drilling rigs and one completion crew. We drilled 41 gross (40 net) wells and completed 43 gross (43 net) wells, and as of December 31, 2022, 29 gross (28 net) wells had been drilled but not completed in our operated South Texas program. Net equivalent production for the year ended December 31, 2022, was 23.2 MMBOE, a 37 percent increase from 16.9 MMBOE for the year ended December 31, 2021. Estimated proved reserves increased 16 percent to 280.0 MMBOE at December 31, 2022, from 240.4 MMBOE at December 31, 2021, as a result of positive infill and price revisions of 75.2 MMBOE and additions of 11.1 MMBOE, partially offset by downward revisions of 23.5 MMBOE and production of 23.2 MMBOE. Additions to proved reserves from extensions were the result of continued success in our development of the Austin Chalk formation. Downward revisions consisted of 14.7 MMBOE resulting from performance revisions and 8.8 MMBOE of proved undeveloped reserves which were replaced by recognizing additions to proved undeveloped reserves associated with different locations that were added to our five-year development plan.
Office Space. As of December 31, 2022, we leased and owned office space as summarized in the table below:
| | | | | | | | | | | | | | |
| | Approximate Square Footage Leased | | Approximate Square Footage Owned |
| Corporate | | 59,000 | | | — | |
| Midland Basin | | 59,000 | | | — | |
| South Texas | | 21,000 | | | 12,000 | |
| Total | | 139,000 | | | 12,000 | |
Reserves
Reserve estimates are inherently imprecise and estimates for new discoveries and undeveloped locations are more imprecise than reserve estimates for producing oil and gas properties. Accordingly, we expect these estimates to change as new information becomes available. The following table presents the standardized measure of discounted future net cash flows and PV-10. PV-10 is a non-GAAP financial measure, and generally differs from the standardized measure of discounted future net cash flows, the most directly comparable GAAP financial measure, because it does not include the effects of income taxes on future net revenues. Neither the standardized measure of discounted future net cash flows nor PV-10 represents the fair market value of our oil and gas properties. We and others in the oil and gas industry use PV-10 as a measure to compare the relative size and value of proved reserves held without regard to the specific tax characteristics of such entities. Please refer to the Glossary section of this report for additional information regarding these measures and refer to the reconciliation of the standardized measure of discounted future net cash flows to PV-10 set forth below. The actual quantities and present value of our estimated proved reserves may be more or less than we have estimated. No estimates of our proved reserves have been filed with or included in reports to any federal authority or agency, other than the SEC, since the beginning of the last fiscal year. The following table should be read along with the Risk Factors section below.
The following table summarizes estimated proved reserves, the standardized measure of discounted future net cash flows (GAAP), PV-10 (non-GAAP), the prices used in the calculation of proved reserves estimates, and reserve life index as of December 31, 2022, 2021, and 2020:
| | | | | | | | | | | | | | | | | |
| As of December 31, |
| 2022 | | 2021 | | 2020 |
| Reserve volumes: | | | | | |
| Proved developed | | | | | |
| Oil (MMBbl) | 110.4 | | | 110.7 | | | 89.8 | |
| Gas (Bcf) | 902.1 | | | 833.0 | | | 643.9 | |
| NGLs (MMBbl) | 57.1 | | | 50.7 | | | 32.1 | |
MMBOE (1) | 317.8 | | | 300.2 | | | 229.3 | |
| Proved undeveloped | | | | | |
| Oil (MMBbl) | 95.4 | | | 88.8 | | | 82.9 | |
| Gas (Bcf) | 500.8 | | | 410.4 | | | 408.1 | |
| NGLs (MMBbl) | 40.7 | | | 34.5 | | | 24.4 | |
MMBOE (1) | 219.6 | | | 191.8 | | | 175.3 | |
Total proved (1) | | | | | |
| Oil (MMBbl) | 205.8 | | | 199.5 | | | 172.7 | |
| Gas (Bcf) | 1,402.9 | | | 1,243.5 | | | 1,052.0 | |
| NGLs (MMBbl) | 97.8 | | | 85.2 | | | 56.6 | |
| MMBOE | 537.4 | | | 492.0 | | | 404.6 | |
| Proved developed reserves percentage | 59 | % | | 61 | % | | 57 | % |
| Proved undeveloped reserves percentage | 41 | % | | 39 | % | | 43 | % |
| | | | | |
| Reserve data (in millions): | | | | | |
| Standardized measure of discounted future net cash flows (GAAP) | $ | 9,962.1 | | | $ | 6,962.6 | | | $ | 2,682.5 | |
| PV-10 (non-GAAP): | | | | | |
| Proved developed PV-10 | $ | 8,234.8 | | | $ | 5,407.2 | | | $ | 1,848.8 | |
| Proved undeveloped PV-10 | 3,919.7 | | | 2,751.4 | | | 833.7 | |
| Total proved PV-10 (non-GAAP) | $ | 12,154.5 | | | $ | 8,158.6 | | | $ | 2,682.5 | |
| | | | | |
12-month trailing average prices: (2) | | | | | |
Oil (per Bbl) | $ | 93.67 | | | $ | 66.56 | | | $ | 39.57 | |
Gas (per MMBtu) | $ | 6.36 | | | $ | 3.60 | | | $ | 1.99 | |
NGLs (per Bbl) | $ | 42.52 | | | $ | 36.60 | | | $ | 17.64 | |
| | | | | |
Reserve life index (years) (3) | 10.1 | | | 9.6 | | | 8.7 | |
____________________________________________
(1)Amounts may not calculate due to rounding.
(2)The prices used in the calculation of proved reserve estimates reflect the unweighted arithmetic average of the first-day-of-the-month price of each month within the trailing 12-month period in accordance with SEC rules. We then adjust these prices to reflect appropriate quality and location differentials over the period in estimating our proved reserves.
(3)Our ability to replace production with new oil and gas reserves is critical to the future success of our business. Please refer to the reserve life index term in the Glossary section of this report for information describing how this metric is calculated.
The following table reconciles the standardized measure of discounted future net cash flows (GAAP) to the PV-10 (non-GAAP) of total estimated proved reserves. Please refer to the Glossary section of this report for the definitions of standardized measure of discounted future net cash flows and PV-10.
| | | | | | | | | | | | | | | | | |
| As of December 31, |
| 2022 | | 2021 | | 2020 |
| (in millions) |
Standardized measure of discounted future net cash flows (GAAP) | $ | 9,962.1 | | | $ | 6,962.6 | | | $ | 2,682.5 | |
Add: 10 percent annual discount, net of income taxes | 7,551.5 | | | 4,844.9 | | | 1,856.3 | |
Add: future undiscounted income taxes | 3,888.3 | | | 2,130.3 | | | — | |
Pre-tax undiscounted future net cash flows | 21,401.9 | | | 13,937.8 | | | 4,538.8 | |
Less: 10 percent annual discount without tax effect | (9,247.4) | | | (5,779.2) | | | (1,856.3) | |
| PV-10 (non-GAAP) | $ | 12,154.5 | | | $ | 8,158.6 | | | $ | 2,682.5 | |
Proved Undeveloped Reserves
Proved undeveloped reserves include those reserves that are expected to be recovered from future wells on undrilled acreage, or from existing wells where a relatively major expenditure is required for recompletion. Undeveloped reserves may be classified as proved reserves on undrilled acreage directly offsetting development areas that are reasonably certain of economic producibility when drilled or where reliable technology provides reasonable certainty of economic producibility. Undrilled locations may be classified as having proved undeveloped reserves only if a development plan has been adopted indicating that they are scheduled to be drilled within five years, unless specific circumstances justify a longer time. As of December 31, 2022, we did not have any proved undeveloped reserves that had been on our books in excess of five years, and none of our proved undeveloped reserves were on acreage expected to expire or on acreage that was not expected to be held through renewal before the targeted completion date.
For proved undeveloped locations that are more than one development spacing area from developed producing locations, we utilized reliable geologic and engineering technology when booking estimated proved undeveloped reserves. Of the 219.6 MMBOE of total proved undeveloped reserves as of December 31, 2022, approximately 40.1 MMBOE of proved undeveloped reserves in the Midland Basin and 65.3 MMBOE of proved undeveloped reserves in South Texas were offset by more than one development spacing area from the nearest proved developed producing location. We incorporated public and proprietary data from multiple sources to establish geologic continuity of each formation and their producing properties. This included seismic data and interpretations (3-D and micro seismic), open hole log information (both vertically and horizontally collected) and petrophysical analysis of that log data, mud logs, gas sample analysis, measurements of total organic content, thermal maturity, test production, fluid properties, and core data as well as statistical performance data yielding predictable and repeatable reserve estimates within certain analogous areas. These locations were limited to only those areas where both established geologic consistency and sufficient statistical performance data could be demonstrated to provide reasonably certain results.
As of December 31, 2022, estimated proved undeveloped reserves increased 27.8 MMBOE, or 15 percent compared with December 31, 2021. The following table provides a reconciliation of our proved undeveloped reserves for the year ended December 31, 2022:
| | | | | |
| Total
(MMBOE) |
| Total proved undeveloped reserves: | |
| Beginning of year | 191.8 | |
| Revisions of previous estimates | 98.3 | |
| Conversions to proved developed | (59.7) | |
| Removed for five-year rule | (19.9) | |
| Additions from extensions and discoveries | 9.1 | |
| |
| |
| End of year | 219.6 | |
Revisions of previous estimates. During 2022, revisions of previous estimates of 98.3 MMBOE primarily related to infill reserves, of which 64.5 MMBOE and 33.8 MMBOE of estimated proved undeveloped reserves were attributable to our South Texas and Midland Basin programs, respectively. Price and performance revisions were each less than 1.0 MMBOE.
Conversions to proved developed. Our 2022 conversion rate was 31 percent and was the result of developing proved reserves in our Austin Chalk and Midland Basin assets. During 2022, we incurred $572.6 million on projects with reserves booked as proved undeveloped at the end of 2021, of which $466.5 million was spent on converting proved undeveloped reserves to proved
developed reserves by December 31, 2022. At December 31, 2022, drilled but not completed wells represented 25.3 MMBOE of total estimated proved undeveloped reserves. We expect to incur $257.7 million of additional capital expenditures in completing these drilled but not completed wells, and we expect all estimated proved undeveloped reserves to be converted to proved developed reserves within five years from their initial booking as proved undeveloped reserves.
Removed for five-year rule. As a result of our testing and delineation efforts in 2022, we revised certain aspects of our future development plan to focus on maximizing returns and the value of our assets. We removed 19.9 MMBOE of estimated proved undeveloped reserves and reclassified these locations to unproved reserve categories, of which 11.1 MMBOE and 8.8 MMBOE related to development schedule optimization in our Midland Basin and South Texas programs, respectively.
Additions from extensions and discoveries. During 2022, we added 5.3 MMBOE and 3.8 MMBOE of estimated proved undeveloped reserves in South Texas and the Midland Basin, respectively. The majority of the additions in South Texas resulted from extensions from our continued success in delineating the Austin Chalk formation, while the majority of the additions in the Midland Basin resulted from further development of our assets.
As of December 31, 2022, estimated future development costs relating to our proved undeveloped reserves totaled $2.8 billion, and we expect to incur approximately $763.2 million, $679.0 million, and $604.4 million in 2023, 2024, and 2025, respectively.
Internal Controls Over Proved Reserves Estimates
Our internal controls over the recording of proved reserves are structured to objectively and accurately estimate our reserve quantities and values in compliance with the SEC’s regulations. Our process for managing and monitoring our proved reserves is delegated to our corporate reserves group and is coordinated by our Corporate Engineering Manager, subject to the oversight of our management and the Audit Committee of our Board of Directors, as discussed below. Our Corporate Engineering Manager has worked in the energy industry since 2008 and has been employed by the Company since 2010. He holds a Bachelor of Science degree in Petroleum Engineering from Montana Technological University and is a Registered Professional Petroleum Engineer in the states of Texas, Wyoming, and Montana. He is also a member of the Society of Petroleum Engineers. Technical, geological, and engineering reviews of our assets are performed throughout the year by our staff. Data obtained from these reviews, in conjunction with economic data and our ownership information, is used in making a determination of estimated proved reserve quantities. Our asset teams’ engineering technical staff do not report directly to our Corporate Engineering Manager; they report to either their respective asset technical managers or directly to the Senior Vice President of Exploration, Development and EHS. This design is intended to promote objective and independent analysis within our asset teams in the proved reserves estimation process.
Third-party Reserves Audit
Ryder Scott is an independent petroleum engineering consulting firm that has been providing petroleum engineering consulting services throughout the world since 1937. Ryder Scott performed an independent audit using its own engineering assumptions, but with economic and ownership data we provided. Ryder Scott audits a minimum of 80 percent of our total calculated proved reserve PV-10. In the aggregate, the proved reserve amounts of our audited properties determined by Ryder Scott are required, per our policy, to be within 10 percent of our proved reserve amounts for the total Company, as well as for each respective major asset. The technical person at Ryder Scott primarily responsible for overseeing our reserves audit is a Senior Vice President who received a Bachelor of Science degree in Petroleum Engineering and a Business Foundations Certificate from The University of Texas at Austin in 2002. She is a licensed Professional Engineer in the State of Texas and a member of the Society of Petroleum Engineers. The 2022 Ryder Scott audit report is included as Exhibit 99.1.
In addition to a third-party audit, our reserves are reviewed by our management with the Audit Committee of our Board of Directors. Our management, which includes our President and Chief Executive Officer, Executive Vice President and Chief Financial Officer, and Senior Vice President of Exploration, Development and EHS, is responsible for reviewing and verifying that the estimate of proved reserves is reasonable, complete, and accurate. The Audit Committee reviews a summary of the final reserves estimate in conjunction with Ryder Scott’s results and also meets with Ryder Scott representatives, separate from our management, from time to time to discuss processes and findings.
Production
The following table summarizes our net production volumes and realized prices for oil, gas, and NGLs produced and sold during the periods presented, and related production expense on a per BOE basis:
| | | | | | | | | | | | | | | | | |
| For the Years Ended December 31, |
| 2022 | | 2021 | | 2020 |
| Net production volumes | | | | | |
| Oil (MMBbl) | 24.0 | | 27.9 | | 23.0 |
| Gas (Bcf) | 125.9 | | 108.4 | | 103.9 |
| NGLs (MMBbl) | 8.0 | | 5.4 | | 6.1 | |
Equivalent (MMBOE) (1) | 53.0 | | 51.4 | | 46.4 |
Midland Basin net production volumes (2) | | | | | |
| Oil (MMBbl) | 19.1 | | | 25.2 | | | 21.3 | |
| Gas (Bcf) | 63.5 | | | 55.4 | | | 46.6 | |
| NGLs (MMBbl) | — | | | — | | | — | |
Equivalent (MMBOE) (1) | 29.7 | | | 34.4 | | | 29.1 | |
Maverick Basin net production volumes (2) | | | | | |
| Oil (MMBbl) | 4.8 | | 2.7 | | 1.7 |
| Gas (Bcf) | 62.4 | | 52.8 | | 57.2 |
| NGLs (MMBbl) | 8.0 | | 5.4 | | 6.1 | |
Equivalent (MMBOE) (1) | 23.2 | | 16.9 | | 17.3 |
| Realized price | | | | | |
| Oil (per Bbl) | $ | 94.67 | | | $ | 67.72 | | | $ | 37.08 | |
| Gas (per Mcf) | $ | 6.28 | | | $ | 4.85 | | | $ | 1.80 | |
| NGLs (per Bbl) | $ | 35.66 | | | $ | 33.67 | | | $ | 13.96 | |
| Per BOE | $ | 63.18 | | | $ | 50.58 | | | $ | 24.26 | |
| Production expense per BOE | | | | | |
| Lease operating expense | $ | 5.03 | | | $ | 4.39 | | | $ | 3.97 | |
| Transportation costs | $ | 2.83 | | | $ | 2.71 | | | $ | 3.06 | |
| Production taxes | $ | 3.07 | | | $ | 2.36 | | | $ | 0.99 | |
| Ad valorem tax expense | $ | 0.79 | | | $ | 0.38 | | | $ | 0.41 | |
____________________________________________
(1)Amounts may not calculate due to rounding.
(2)For each of the years ended December 31, 2022, 2021, and 2020, total estimated proved reserves attributed to our Midland Basin field and our Maverick Basin field each exceeded 15 percent of our total estimated proved reserves expressed on an equivalent basis.
Productive Wells
As of December 31, 2022, we had working interests in 859 gross (765 net) productive oil wells and 499 gross (465 net) productive gas wells. Productive wells are wells producing in commercial quantities or wells capable of commercial production that are temporarily shut-in. Multiple completions in the same wellbore are counted as one well, and as of December 31, 2022, two of these wells had multiple completions. A well is categorized under state reporting regulations as an oil well or a gas well based on the ratio of gas to oil when it first commenced production, but such designation may not be indicative of current or future production composition.
Drilling and Completion Activity
All of our drilling and completion activities are conducted by independent contractors using equipment they own and operate. The following table summarizes the number of operated and outside-operated wells drilled and completed or recompleted on our properties in 2022, 2021, and 2020, excluding non-consented projects, active injector wells, saltwater disposal wells, or wells in which we own only a royalty interest:
| | | | | | | | | | | | | | | | | | | | | | | | | | | | | | | | | | | |
| For the Years Ended December 31, |
| 2022 | | 2021 | | 2020 |
| Gross | | Net | | Gross | | Net | | Gross | | Net |
| Development wells | | | | | | | | | | | |
| Oil | 68 | | | 57 | | | 107 | | | 91 | | | 78 | | | 71 | |
| Gas | 18 | | | 18 | | | 11 | | | 8 | | | — | | | — | |
| Non-productive | — | | | — | | | — | | | — | | | — | | | — | |
| 86 | | | 75 | | | 118 | | | 99 | | | 78 | | | 71 | |
| Exploratory wells | | | | | | | | | | | |
| Oil | 4 | | | 3 | | | 2 | | | 2 | | | 5 | | | 5 | |
| Gas | 2 | | | 2 | | | 8 | | | 8 | | | 1 | | | 1 | |
| Non-productive | 1 | | | 1 | | | — | | | — | | | — | | | — | |
| 7 | | | 6 | | | 10 | | | 10 | | | 6 | | | 6 | |
| Total | 93 | | | 81 | | | 128 | | | 109 | | | 84 | | | 77 | |
____________________________________________
Note: The number of wells drilled refers to the number of wells completed at any time during the respective year, regardless of when drilling was initiated.
In addition to the wells completed in 2022 (included in the table above), we were actively participating in the drilling of 10 gross (nine net) wells and had 74 gross (66 net) drilled but not completed wells as of January 31, 2023. Drilled but not completed wells as of January 31, 2023, represent wells that were being completed or were waiting on completion. The drilled but not completed well count as of January 31, 2023, includes nine gross (nine net) wells that are not included in our five-year development plan, eight of which are in the Eagle Ford shale.
Title to Properties
As of December 31, 2022, over 97 percent of our operated oil and gas producing assets are located on private lands, are held pursuant to oil and gas leases from private mineral owners, and are not located on federal lands or leased from the federal government. The remainder of our operated oil and gas producing assets are located on Texas state lands. We have obtained title opinions or have conducted other title review on substantially all of our producing properties and believe we have satisfactory title to such properties. We obtain new or updated title opinions prior to commencing initial drilling operations on the properties that we operate. Most of our producing properties are subject to mortgages securing indebtedness under our Credit Agreement, as defined in Note 5 – Long-Term Debt in Part II, Item 8 of this report, royalty and overriding royalty interests, liens for current taxes, and other ordinary course burdens that we believe do not materially interfere with the development of such properties. We typically perform title investigations in accordance with standards generally accepted in the oil and gas industry before acquiring developed and undeveloped leasehold acreage.
Acreage
The following table sets forth the number of gross and net surface acres of developed and undeveloped oil and gas leasehold, fee properties, and mineral servitudes that we held as of December 31, 2022:
| | | | | | | | | | | | | | | | | | | | | | | | | | | | | | | | | | | |
| Developed Acres (1) | | Undeveloped Acres (2)(3) | | Total |
| Gross | | Net | | Gross | | Net | | Gross | | Net |
| Midland Basin: | | | | | | | | | | | |
| RockStar | 68,090 | | | 61,987 | | | 2,178 | | | 1,512 | | | 70,268 | | | 63,499 | |
| Sweetie Peck | 19,793 | | | 16,437 | | | 2,567 | | | 533 | | | 22,360 | | | 16,970 | |
Midland Basin Total (4) | 87,883 | | | 78,424 | | | 4,745 | | | 2,045 | | | 92,628 | | | 80,469 | |
| South Texas | 85,834 | | | 85,418 | | | 72,319 | | | 69,400 | | | 158,153 | | | 154,818 | |
Other (5) | 10,499 | | | 10,499 | | | 89,691 | | | 25,306 | | | 100,190 | | | 35,805 | |
| Total | 184,216 | | | 174,341 | | | 166,755 | | | 96,751 | | | 350,971 | | | 271,092 | |
____________________________________________
(1)Developed acreage is acreage assigned to producing wells for the state approved spacing unit for the producing formation. Our developed acreage that includes multiple formations with different well spacing requirements may be considered undeveloped for certain formations but has been included only as developed acreage in the table above.
(2)Undeveloped acreage is acreage on which wells have not been drilled or completed to a point that would permit the production of commercial quantities of oil, gas, and/or NGLs regardless of whether such acreage contains estimated net proved reserves.
(3)As of February 9, 2023, 66, 540, and one net acre of our undeveloped acreage is scheduled to expire by December 31, 2023, 2024, and 2025, respectively, unless production is established or we take other action to extend the terms of the applicable leases. Certain of our acreage, primarily in South Texas, is subject to lease consolidation agreements containing drilling, completion, and other obligations that we currently intend to satisfy. Failure to meet these obligations results in payments to lessors, or termination of the lease consolidation agreements, which could result in additional future lease expirations if continuous development obligations required by individual leases are not met.
(4)As of December 31, 2022, total Midland Basin acreage excludes approximately 1,523 net acres associated with drill-to-earn opportunities that we intend to pursue.
(5)Includes other non-core acreage located in Colorado, Louisiana, Montana, North Dakota, Texas, Utah, and Wyoming.
Delivery Commitments
For gathering, processing, transportation throughput, and delivery commitments, please refer to Pipeline Transportation Commitments within Note 6 – Commitments and Contingencies in Part II, Item 8 of this report.
Major Customers
For major customers and entities under common control that accounted for 10 percent or more of our total oil, gas, and NGL production revenue for at least one of the years ended December 31, 2022, 2021, and 2020, please refer to Concentration of Credit Risk and Major Customers within Note 1 – Summary of Significant Accounting Policies in Part II, Item 8 of this report.
Human Capital
Our Company culture, which seeks to recognize our employees as our most valuable asset, thrives on the strong relationships we have built with our employees and drives the manner in which we pursue our short-term and long-term goals, as well as our efforts to attract and retain talent. Through our culture, we promote:
•integrity and ethical behavior in the conduct of our business;
•environmental, health, and safety priorities;
•prioritizing the success of others and the team;
•collaboration and openness to new ideas and technologies that serve business improvement;
•support for team members’ professional and personal development; and
•support for the communities where we live and work.
The core values of integrity and ethical behavior are the pillars of our culture, and all employees are responsible for upholding Company-wide standards and values. We have many long-standing policies designed to promote ethical conduct and integrity, which employees are required to read and acknowledge on an annual basis. The health and safety of our employees and contractors is our highest priority. We strive to achieve performance excellence in environmental, health, and safety management, and compensation of
all employees is tied to annual environmental, health, and safety performance goals. Personal and professional development is an important part of our culture and is employee driven, manager facilitated, and organizationally supported. Employees are routinely provided training opportunities to develop skills in leadership, safety, and technical acumen, which help strengthen our efforts to conduct business with high ethical standards. During 2022, many of our employees participated in three key leadership and talent development programs that included more than 5,800 hours of training, exclusive of safety and other specialized technical training. We measure employee engagement and satisfaction through periodic surveys, administered by an independent third-party vendor. We are proud of our many outstanding employees who invest their time, talents, and financial resources in their communities. Our charitable giving program includes a monetary match of our employees’ personal contributions to qualified organizations and up to 12 hours per employee of Company-granted time to volunteer in the communities where we live and work.
We strive to provide competitive, performance-based compensation and benefits to our employees, including market-competitive pay, short-term and long-term incentive compensation plans, an employee stock purchase program, and various healthcare, retirement, and other benefit packages such as a hybrid work environment that is guided by each employee’s job function and responsibilities. Compensation for our executives and employees under our short-term and long-term incentive plans is determined based on individual performance and Company performance with respect to qualitative and quantitative metrics that include environmental, health, and safety measures. The Compensation Committee of our Board of Directors oversees our compensation programs and regularly modifies program design to incentivize achievement of our corporate strategy and the matters of importance to our stakeholders. Significant planning for succession of key personnel is performed each year, or more frequently as deemed necessary by management.
As of February 9, 2023, we had 539 full-time employees, none of whom were subject to a collective bargaining agreement. We are committed to diversity at all levels of our organization and we strive to provide equal employment opportunities to all employees and job applicants. On an annual basis, we retain a third party to analyze our workforce demographics and conduct discrimination and pay equity testing. No discriminatory practices have been identified and no evidence of discrimination or pay inequity has been found. Additionally, we have established procedures and controls designed to support our objective of remaining, at all times, in material compliance with federal, state, and local laws and governmental regulations.
The following charts present certain Board of Directors and workforce metrics as of February 9, 2023:
| | | | | | | | | | | |
| Board of Directors Diversity (1) | Officer Gender Diversity (2) | |
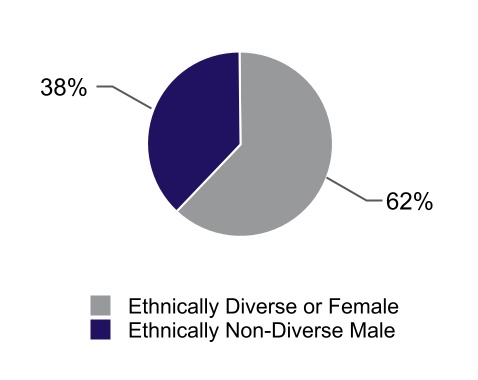
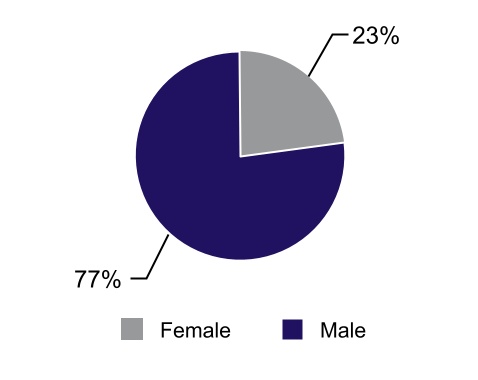
| | | | | | | | | | | |
| Employee Ethnic Diversity (1) | Employee Gender Diversity | |
____________________________________________
(1)Ethnic diversity data is determined under guidelines set forth by the United States Equal Employment Opportunity Commission and includes employees in the following categories: American Indian or Alaska Native, Asian, Black or African American, Hispanic or Latino, or the combination of two or more races (not Hispanic or Latino).
(2)Includes officers at the level of Vice President and above, and reflects the recent announcements of officer retirements and new appointments.
Seasonality
The price of crude oil is primarily driven by global socioeconomic and geopolitical factors and is less affected by seasonal fluctuations; however, demand for energy is generally higher in the winter and in the summer driving season. The demand and price for gas generally increases during winter months and decreases during summer months. To lessen the impact of seasonal gas demand and price fluctuations, pipelines, utilities, local distribution companies, and industrial users regularly utilize gas storage facilities and forward purchase some of their anticipated winter requirements during the summer. However, increased summertime demand for electricity can divert gas that is traditionally placed into storage which, in turn, may increase the typical winter seasonal price. Seasonal anomalies, such as mild or extreme winters sometimes lessen or exacerbate these fluctuations.
Certain of our drilling, completion, and other operational activities are also subject to seasonal limitations. Seasonal weather conditions, government regulations, and lease stipulations could adversely affect our ability to conduct drilling activities in some of the areas where we operate. Please refer to Risk Factors in Part I, Item 1A of this report for additional discussion.
Competition
The oil and gas industry is highly competitive, particularly with respect to acquiring prospective oil and gas properties. We believe our acreage positions provide a foundation for development activities that we expect to fuel our future growth. Our competitive position also depends on our geological, geophysical, and engineering expertise, as well as our financial resources. We believe the location of our acreage; our exploration, drilling, operational, and production expertise; available technologies; our financial resources and expertise; and the experience and knowledge of our management and technical teams enable us to compete in our core operating areas. However, we face intense competition from many major and independent oil and gas companies, which in some cases have larger technical teams and greater financial and operational resources than we do. Many of these companies not only engage in the acquisition, exploration, development, and production of oil and gas reserves, but also have gathering, processing or refining
operations, market refined products, provide, dispose of and transport fresh and produced water, own drilling rigs or production equipment, or generate electricity, all of which, individually or in the aggregate, could provide such companies with a competitive advantage.
We also compete with other oil and gas companies in securing drilling rigs and other equipment and services necessary for the drilling, completion, and maintenance of wells, as well as for the gathering, transporting, and processing of oil, gas, NGLs, and water. Consequently, we may face shortages, delays, or increased costs in securing these services from time to time. The oil and gas industry also faces competition from alternative fuel sources, including renewable energy sources such as solar and wind-generated energy, and other fossil fuels such as coal. Competitive conditions may be affected by future energy, environmental, climate-related, financial, or other policies, legislation, and regulations.
In addition, we compete for professionals in our workforce, including specialized roles in the oil and gas industry such as geologists, geophysicists, engineers, and others. Throughout the general labor market, the need to attract and retain talented people has grown at a time when the availability of individuals with these skills is becoming more limited due to the evolving demographics of our industry. The oil and gas industry is not insulated from the competition for quality people, and we must compete effectively to be successful. Please refer to Human Capital above and Risk Factors in Part I, Item 1A of this report for additional discussion.
Government Regulations
Although our regulatory compliance obligations are mitigated by the fact that we do not own or operate oil and gas properties on federal lands, nearly every aspect of our business is subject to expansive federal, state, and local laws and governmental regulations. These laws and regulations frequently change in response to economic or political conditions, or other developments, and our regulatory burden may increase in the future. Laws and regulations have the potential to increase our cost of conducting business and consequently could affect our profitability.
Energy Regulations
Texas, the state where we conduct operations and lease or own nearly all of our oil and gas assets, has adopted laws and regulations governing the exploration for and production of oil, gas, and NGLs, including laws and regulations requiring permits for the drilling of wells, imposing bond requirements in order to drill or operate wells, governing the timing of drilling and location of wells, the method of drilling and casing wells, the surface use and restoration of properties upon which wells are drilled, and the plugging and abandonment of wells. Our operations are also subject to Texas conservation laws and regulations, including regulations governing the size of drilling and spacing units or proration units, the number of wells that may be drilled in an area, the spacing of wells, and the unitization or pooling of oil and gas properties. In addition, Texas conservation laws establish maximum rates of production from oil and gas wells, generally limit or prohibit the venting or flaring of gas, and may impose certain requirements regarding the ratability or fair apportionment of production from fields and individual wells.
Our sales of gas are affected by the availability, terms, and cost of gas pipeline transportation. The Federal Energy Regulatory Commission (“FERC”) has jurisdiction over the transportation and sale for resale of gas in interstate commerce. FERC’s current regulatory framework generally provides for a competitive and open access market for sales and transportation of gas. However, FERC regulations continue to affect the midstream and transportation segments of the industry, and thus can indirectly affect the sales prices we receive for gas production.
Environmental, Health, and Safety Matters
General. Our operations are subject to stringent and complex federal, state, and local laws and regulations governing protection of the environment and worker health and safety, as well as the discharge of materials and emissions into the environment. These laws and regulations may, among other things:
•require the acquisition of various permits before drilling commences;
•restrict the types, quantities, and concentration of various substances and emissions that may be released into the environment in connection with oil and gas drilling and production and saltwater disposal activities;
•limit or prohibit drilling activities on certain lands lying within wilderness, wetlands, and other protected areas, including areas containing certain wildlife or threatened and endangered plant and animal species; and
•require remedial measures to mitigate pollution from former and ongoing operations, such as closing pits and plugging abandoned wells.
These laws, rules, and regulations may also restrict the rate of oil and gas production below the rate that would otherwise be possible. The regulatory burden on the oil and gas industry increases the cost of conducting business and consequently affects profitability. Additionally, environmental laws and regulations are revised frequently, and any changes may result in more stringent, or different permitting, waste handling, disposal, and cleanup requirements for the oil and gas industry and could have a significant impact on our operating costs.
The following is a summary of some of the existing laws, rules, and regulations to which our business is subject.
Waste handling. The Resource Conservation and Recovery Act (“RCRA”) and comparable state statutes regulate the generation, transportation, treatment, storage, disposal, and cleanup of hazardous and non-hazardous wastes. Under the auspices of the United States Environmental Protection Agency (“EPA”), individual states administer some or all of the provisions of RCRA, sometimes in conjunction with their own, more stringent requirements. Drilling fluids, produced water, and most of the other wastes associated with the exploration, development, and production of oil or gas are currently regulated under RCRA’s non-hazardous waste provisions. However, it is possible that certain oil and gas exploration and production wastes now classified as non-hazardous could be classified as hazardous wastes in the future. Any such change could result in an increase in our costs to manage and dispose of wastes, which could have a material adverse effect on our results of operations and financial position.
Comprehensive Environmental Response, Compensation, and Liability Act. The Comprehensive Environmental Response, Compensation, and Liability Act (“CERCLA”), also known as the Superfund law, imposes joint and several liability, without regard to fault or legality of conduct, on classes of persons who are considered to be responsible for the release or threatened release of a hazardous substance into the environment. These persons include the owner or operator of the site where the release occurred, and anyone who disposed or arranged for the disposal of, or transported, a hazardous substance released at the site. Under CERCLA, such persons may be subject to joint and several liability for the costs of cleaning up the hazardous substances that have been released into the environment, for damages to natural resources and for the costs of environmental investigation and certain health studies. In addition, it is not uncommon for third-parties to file claims for personal injury and property damage allegedly caused by the hazardous substances released into the environment.
We currently own, lease, or operate numerous properties that have been used for oil and gas exploration and production for many years. CERCLA excludes petroleum and natural gas from its definition of hazardous substances, and although we believe we have utilized operating and waste disposal practices that were standard in the industry at the time, hazardous substances or wastes may have been released on or under the properties owned or leased by us, or on or under other locations, including off-site locations, where such substances have been taken for disposal. In addition, some of our properties have been operated by third-parties or by previous owners or operators whose treatment and disposal of hazardous substances, wastes, or hydrocarbons were not under our control. These properties, and the substances disposed or released on them, may be subject to CERCLA, RCRA, and analogous state laws. Under such laws, we could be required to remove previously disposed substances and wastes, pay fines, remediate contaminated property, or perform remedial operations to prevent future contamination.
Water discharges. The federal Water Pollution Control Act (“Clean Water Act”) and analogous state laws impose restrictions and strict controls with respect to the discharge of pollutants, including spills and leaks of oil and other substances, into waters of the United States and states. The discharge of pollutants into regulated waters is prohibited, except in accordance with the terms of a permit issued by the EPA, or analogous state agencies. This includes the discharge of certain storm water without a permit which requires periodic monitoring and sampling. In addition, the Clean Water Act regulates wastewater generated by unconventional oil and gas operations during the hydraulic fracturing process and discharged to publicly-owned wastewater treatment facilities. The Clean Water Act also prohibits discharge of dredged or fill material into waters of the United States, including wetlands, except in accordance with the terms of a permit issued by the United States Army Corps of Engineers, or a state, if the state has assumed authority to issue such permits. Federal and state regulatory agencies can impose administrative, civil, and criminal penalties for non-compliance with discharge permits or other requirements of the Clean Water Act and analogous state laws and regulations.
The Oil Pollution Act of 1990 (“OPA”) addresses prevention, containment and cleanup, and liability associated with oil pollution. OPA applies to vessels, offshore platforms, and onshore facilities. OPA subjects owners of such facilities to strict liability for containment and removal costs, natural resource damages, and certain other consequences of oil spills into jurisdictional waters. Any unpermitted release of petroleum or other pollutants from our operations could result in governmental penalties and civil liability.
Air emissions. The federal Clean Air Act (“CAA”) and comparable state laws and regulations regulate emissions of various air pollutants through air emissions permitting programs and the imposition of other requirements, such as requirements for emission reduction, capture and control. In addition, the EPA has developed, and continues to develop, stringent regulations governing emissions of hazardous air pollutants at specified sources. Federal and state regulatory agencies can impose administrative, civil, and criminal penalties for non-compliance with air permits or other requirements of the CAA and associated state laws and regulations. Please refer to the Environmental section in Part II, Item 7 of this report for additional information about the regulation of air emissions from the oil and gas sector.
Climate change. In December 2009, the EPA determined that emissions of carbon dioxide, methane, and other GHGs endanger public health and welfare, and as a result, began adopting and implementing a comprehensive suite of regulations to restrict emissions of GHGs under existing provisions of the CAA. While President Trump’s administration took steps to rescind or review many of these regulations, President Biden’s administration has actively been reviewing those actions and taking steps to strengthen and expand the regulations, specifically targeting, among other things, the regulation of methane emissions from the oil and gas sector. Legislative and regulatory initiatives related to climate change could have an adverse effect on our operations and the demand for oil and gas. Please refer to Risk Factors - Risks Related to Oil and Gas Operations and the Industry - Legislative and regulatory initiatives and litigation related to global warming and climate change could have an adverse effect on our operations and the demand for oil, gas, and NGLs, and could result in significant litigation and related expenses in Part I, Item 1A of this report. Meteorological or extreme
weather events (whether or not related to climate change), pose additional risks to our operations, which have included temporary shut-in of certain wells and temporary capacity constraints at third-party purchasers to receive our products.
Endangered species. The federal Endangered Species Act and analogous state laws regulate activities that could have an adverse effect on threatened or endangered species. Some of our operations are conducted in areas where protected species are known to exist. In these areas, we may be obligated to develop and implement plans to avoid potential adverse impacts on protected species, and we may be prohibited from conducting operations in certain locations or during certain seasons, such as breeding and nesting seasons, when our operations could have an adverse effect on these species. It is also possible that a federal or state agency could order a complete halt to activities in certain locations if it is determined that such activities may have a serious adverse effect on a protected species. The presence of a protected species in areas where we perform drilling, completion, and production activities could impair our ability to timely complete well drilling and development and could adversely affect our future production from those areas.
OSHA and other laws and regulations. We are subject to the requirements of the federal Occupational Safety and Health Act (“OSHA”) and comparable state statutes. The OSHA hazard communication standard, the EPA community right-to-know regulations under Title III of CERCLA and similar state statutes require that we organize and/or disclose information about hazardous materials used or produced in our operations. Also, pursuant to OSHA, the Occupational Safety and Health Administration has established a variety of standards relating to workplace exposure to hazardous substances and employee health and safety. We believe we are in substantial compliance with the applicable requirements of OSHA and comparable laws.
Hydraulic fracturing. Hydraulic fracturing is an important and common practice used to stimulate production of hydrocarbons from tight shale formations. We routinely utilize hydraulic fracturing techniques in most of our drilling and completion programs. The process involves the injection of water, sand, and chemicals under pressure into the formation to fracture the surrounding rock and stimulate production. The process is typically regulated by state oil and gas commissions. However, even on private lands, the EPA has asserted federal regulatory authority over hydraulic fracturing involving diesel additives under the Safe Drinking Water Act’s Underground Injection Control Program. The federal Safe Drinking Water Act protects the quality of the nation’s public drinking water through the adoption of drinking water standards and controlling the injection of waste fluids, including saltwater disposal fluids, into below-ground formations that may adversely affect drinking water sources.
Increased regulation and scrutiny on oil and gas activities involving hydraulic fracturing techniques could potentially lead to a decrease in the completion of new oil and gas wells, an increase in compliance costs, delays, and changes in federal income tax laws, all of which could adversely affect our financial position, results of operations, and cash flows. As new laws or regulations that significantly restrict hydraulic fracturing are adopted at the state and local levels, such laws could make it more difficult or costly for us to perform fracturing to stimulate production from tight formations. In addition, if hydraulic fracturing becomes regulated at the federal level as a result of federal legislation or regulatory initiatives by the EPA or other federal agencies, our fracturing activities could become subject to additional permitting requirements, which could result in additional permitting delays and potential increases in costs. Restrictions on hydraulic fracturing could also reduce the amount of oil and gas that we are ultimately able to produce from our reserves.
We believe the trend in local, state, and federal environmental legislation and regulation will continue toward stricter standards, particularly under President Biden’s administration. While we believe we are in substantial compliance with existing environmental laws and regulations applicable to our current operations and that our continued compliance with existing requirements will not have a material adverse impact on our financial condition and results of operations, we cannot give any assurance that we will not be adversely affected in the future.
Environmental, Health, and Safety Initiatives. We are committed to exceptional safety, health, and environmental stewardship; making a positive difference in the communities where we live and work; and transparency in reporting our progress in these areas. We set annual goals for our safety, health, and environmental program focused on reducing the number of safety related incidents and the number and impact of spills of produced fluids. In addition, we set annual goals for GHG emissions intensity and methane emissions as a percentage of total methane produced, and as part of our current ESG initiatives, we have set goals that include reducing flaring and GHG emissions intensity, and maintaining low methane emissions intensity. We also periodically conduct audits of our operations to ensure regulatory compliance, and we strive to provide appropriate training for our employees. Reducing air emissions as a result of leaks, venting, or flaring of gas during operations has become a major focus area as we consider this a best practice and seek to comply with regulations. While flaring is sometimes necessary, reducing these volumes is a priority for us. To avoid flaring when possible, we restrict testing periods and connect our production to gas pipeline infrastructure as quickly as possible after well completions. We have incurred in the past, and expect to incur in the future, capital costs related to environmental compliance. Such expenditures are included within our overall capital budget and are not separately itemized.
Available Information
Our internet website address is www.sm-energy.com. We routinely post important information for investors on our website. Within our website’s investor relations section, we make available free of charge our annual report on Form 10-K, quarterly reports on Form 10-Q, current reports on Form 8-K, and amendments to those reports filed with or furnished to the SEC under applicable securities laws. These materials are made available as soon as reasonably practical after we electronically file such materials with or furnish such materials to the SEC, and can also be located at www.sec.gov. We also make available through our website our Corporate
Governance Guidelines, Code of Business Conduct and Conflict of Interest Policy, Financial Code of Ethics, and the Charters of the Audit, Compensation, Executive, and Environmental, Social and Governance committees of our Board of Directors. Information on our website is not incorporated by reference into this report and should not be considered part of this document.
ITEM 1A. RISK FACTORS
In addition to the other information included in this report, the following risk factors should be carefully considered when evaluating an investment in us.
Risks Related to Commodity Prices and Global Macroeconomics
Oil, gas, and NGL prices are volatile, and declines in prices may adversely affect our profitability, financial condition, cash flows, access to capital, and ability to grow.
Our revenues, operating results, profitability, future rate of growth, and the carrying value of our oil and gas properties depend heavily on the prices we receive for oil, gas, and NGL sales. Oil, gas, and NGL prices also affect our cash flows available for capital expenditures, debt reductions, return of capital, and other expenditures, our borrowing capacity, and the volume and value of our oil, gas, and NGL reserves. In addition, we may have oil and gas property impairments or downward revisions of estimates of proved reserves if prices fall significantly. Please refer to Significant Developments in 2022 and Reserves in Part I, Items 1 and 2, Comparison of Financial Results and Trends Between 2022 and 2021 and Between 2021 and 2020 in Part II, Item 7, and Note 1 – Summary of Significant Accounting Policies, Note 8 – Fair Value Measurements, and Supplemental Oil and Gas Information (unaudited) in Part II, Item 8 for specific discussion.
Historically, the markets for oil, gas, and NGLs have been volatile, and they are likely to continue to be volatile. Wide fluctuations in oil, gas, and NGL prices often result from relatively minor changes in the supply of and demand for oil, gas, and NGLs, market uncertainty, and other factors that are beyond our control, including:
•global and domestic supplies of oil, gas, and NGLs, and the productive capacity of the industry as a whole;
•the level of consumer demand for oil, gas, and NGLs;
•overall global and domestic economic conditions;
•inflation and other economic factors that contribute to market volatility;
•weather conditions;
•the availability and capacity of gathering, transportation, processing, storage, and/or refining facilities in asset-specific or localized areas;
•liquefied natural gas deliveries to and from the United States;
•the increased demand for, price, and availability of alternative fuels or sources of energy;
•technological advances in, and regulations affecting, energy consumption and conservation;
•the ability of the members of OPEC+ to maintain effective oil price and production controls;
•political instability or armed conflict involving oil or gas producing countries or regions, such as the continued conflict occurring between Russia and Ukraine;
•actual or perceived epidemic or pandemic risks;
•strengthening and weakening of the United States dollar relative to other currencies;
•stockholder activism or activities by non-governmental organizations to limit sources of funding or restrict the exploration and production of oil, gas, and NGLs and related infrastructure; and
•governmental regulations and taxes.
Declines in oil, gas, and NGL prices would reduce our revenues and could also reduce the amount of oil, gas, and NGLs that we can produce economically, which could have a material adverse effect on our business, financial condition, liquidity, results of operations, and prospects.
Future oil, gas, and NGL price declines or unsuccessful exploration efforts may result in write-downs of our asset carrying values.
We follow the successful efforts method of accounting for our oil and gas properties. All property acquisition costs and development costs are capitalized when incurred. Exploratory well costs are initially capitalized, pending the determination of whether proved reserves have been discovered. If commercial quantities of proved reserves are not discovered with an exploratory well, the costs of drilling the well are expensed as dry hole costs.
The capitalized costs of our oil and gas properties, on a depletion pool basis, cannot exceed the estimated undiscounted future net cash flows of that depletion pool. If net capitalized costs exceed undiscounted future net cash flows, we generally must write down the costs of each depletion pool to the estimated discounted future net cash flows of that depletion pool. Write downs for unproved
properties are also evaluated for carrying costs in excess of fair value. This evaluation considers the potential for abandonment due to actual and anticipated lease expirations, as well as actual and anticipated losses on acreage due to title defects, changes in development plans, and other inherent acreage risks. Declines in the prices of oil, gas, or NGLs, or unsuccessful exploration efforts, could cause proved and/or unproved property impairments in the future, which could have a material adverse effect on our business, financial condition, liquidity, and results of operations.
We review the carrying values of our properties for indicators of impairment on a quarterly basis using the prices in effect as of the end of each quarter. Once incurred, a write-down of oil and gas properties held for use cannot be reversed at a later date, even if oil, gas, or NGL prices increase.
Weakness in economic conditions, continued inflation, or uncertainty in financial markets may have material adverse impacts on our business that we cannot predict.
Historically, the United States and global economies and financial systems have experienced turmoil and upheaval characterized by extreme volatility in prices of equity and debt securities, periods of diminished liquidity and credit availability, inability to access capital markets, the bankruptcy, failure, collapse, or sale of financial institutions, inflation, and heightened levels of intervention by the United States federal government and other governments. Weakness or uncertainty in the United States economy or other large economies could have a material adverse effect on our business and financial condition. For example:
• inflation has increased the costs of our drilling and completion activities, and the costs of oilfield services, equipment, and materials during 2022 and could continue or worsen and further impact our financial condition, liquidity, and results of operations, and could limit our pool of economic development opportunities;
•a potential economic recession could impact demand for oil, gas, and NGLs, and cause commodity price volatility;
•the tightening of credit or lack of credit availability to our customers could adversely affect our ability to collect our trade receivables;
•the liquidity available under our Credit Agreement could be reduced if one or more of our lenders is unable to fund its commitment;
• our ability, or the ability of our suppliers or contractors, to access the capital markets may be restricted or non-existent at a time when we or they would like, or need, to raise capital for our or their business, including for the exploration and/or development of reserves;
• our commodity derivative contracts could become economically ineffective if our counterparties are unable to perform their obligations or seek bankruptcy protection;
•the Federal Reserve could continue to increase interest rates in an effort to curb inflation, as they have done during 2022 and into 2023, which could result in increased borrowing costs;
•variable interest rate spread levels, including for SOFR and the prime rate, could increase significantly, resulting in higher interest costs for unhedged variable interest rate based borrowings under our Credit Agreement; and
•changes in tax laws and regulations could require us to adjust our business plan.
Global geopolitical tensions, specifically including the ongoing conflict between Russia and Ukraine, may create heightened volatility in oil, gas, and NGL prices and could adversely affect our business, financial condition and results of operations.
On February 24, 2022, Russian military forces commenced a military operation in Ukraine and the sustained conflict and disruption in the region that has occurred since this date is expected to continue for the foreseeable future. Although the length, impact, and outcome of the ongoing military conflict in Ukraine is highly unpredictable, this conflict could lead to significant market and other disruptions, including significant volatility in commodity prices and supply of energy resources, instability in financial markets, supply chain interruptions, political and social instability, changes in consumer or purchaser preferences, as well as increases in cyberattacks and espionage.
While it is not possible at this time to predict or determine the ultimate consequences of the conflict in Ukraine, the conflict is likely to continue for the foreseeable future and could include, among other things: additional sanctions, greater regional instability, embargoes, geopolitical shifts, and other material and adverse effects on macroeconomic conditions, supply chains, financial markets, and hydrocarbon price volatility. To the extent negotiations of a cease fire between Russia and Ukraine are unsuccessful, the potential destruction of critical oil-related infrastructure in Ukraine, and the implementation of further sanctions and other measures taken by governmental bodies and others, could have a lasting impact on the operations and financial condition of our business and the global economy.
The global COVID-19 Pandemic has impacted, and may continue to impact, us and our industry and could have a material adverse effect on our business, financial condition, liquidity, results of operations and prospects.
Beginning in 2020, the Pandemic spread across the globe and disrupted markets and economies around the world, including the oil, gas, and NGL industry in which we operate. The Pandemic continues to impact certain countries and markets to varying degrees,
and as a result, the markets for the commodities produced by our industry remain subject to heightened levels of uncertainty. Volatile market conditions could continue and could impact our business, financial condition, liquidity, results of operations, prospects, or the timing of further recovery, and may require us to adjust our business plan. In addition to risks directly related to the Pandemic, the Pandemic could increase the likelihood and magnitude of the other risk factors described in this section.
Risks Related to Oil and Gas Operations and the Industry
The loss of personnel could adversely affect our business.
We depend to a large extent on the efforts and continued employment of our executive management team, other key personnel, and our general labor force. The loss of their services could adversely affect our business. Our success in drilling and completing new wells and the success of other activities integral to our operations will depend, in part, on our ability to attract and retain experienced geologists, engineers, landmen, and other professionals. Competition for many of these professionals can be intense. If we cannot retain our technical personnel or attract additional experienced technical personnel and professionals, our ability to compete could be harmed.
Our operations are subject to complex laws and regulations, including environmental regulations, that result in substantial costs and other risks.
Federal, state, and local authorities extensively regulate the oil and gas industry. Legislation and regulations affecting the industry are under constant review for amendment or expansion, raising the possibility of changes that may become more stringent and, as a result, may affect, among other things, the pricing, or marketing of oil, gas, and NGL production. Non-compliance with statutes and regulations and more vigorous enforcement of such statutes and regulations by regulatory agencies may lead to increased operational and compliance costs, substantial administrative, civil, and criminal penalties, including the assessment of natural resource damages, the imposition of significant investigatory and remedial obligations and may also result in the suspension or termination of our operations. The overall regulatory burden on the industry increases the cost to place, design, drill, complete, install, operate, and abandon wells and related facilities and, in turn, decreases profitability.
Governmental authorities regulate various aspects of drilling for and the production of oil, gas, and NGLs, including the permit and bonding requirements of drilling wells, the spacing of wells, the unitization or pooling of interests in oil and gas properties, rights-of-way and easements, disposal of produced water, environmental matters, occupational health and safety, the sharing of markets, production limitations, plugging, abandonment, restoration standards, and oil and gas operations. Public interest in environmental protection has increased in recent years, and environmental organizations have opposed, with some success, certain projects. Under certain circumstances, regulatory authorities may deny a proposed permit or right-of-way grant or impose conditions of approval to mitigate potential environmental impacts, which could, in either case, negatively affect our ability to explore or develop certain properties. Any such delay, suspension, or termination could have a material adverse effect on our operations.
Our operations are also subject to complex and constantly changing environmental laws and regulations adopted by federal, state, and local governmental authorities in jurisdictions where we are engaged in exploration or production operations. New laws or regulations, or changes to current requirements, including the designation of previously unprotected wildlife or plant species as threatened or endangered in areas we operate in, could result in material costs or claims with respect to properties we own or have owned or limitations on exploration and production activities in certain locations. We will continue to be subject to uncertainty associated with new regulatory interpretations and inconsistent interpretations between state and federal agencies. Under existing or future environmental laws and regulations, we could incur significant liability, including joint and several, strict liability under federal, state, and local environmental laws for emissions and for discharges of oil, gas, and NGLs or other pollutants into the air, soil, surface water, or groundwater as described in Government Regulations in Part I, Items 1 and 2 of this report. Existing environmental laws or regulations, as currently interpreted or enforced, or as they may be interpreted, enforced, or altered in the future, may have a material adverse effect on us.
Federal and state legislative and regulatory initiatives relating to hydraulic fracturing could result in increased costs and additional operating restrictions or delays.
Hydraulic fracturing is a common practice in the oil and gas industry used to stimulate the production of oil, gas, and NGLs from dense subsurface rock formations. We routinely apply hydraulic fracturing techniques to many of our oil and gas properties, including our unconventional resource plays within our Midland Basin and South Texas assets. Hydraulic fracturing involves injecting water, sand, and certain chemicals under pressure to fracture the hydrocarbon-bearing rock formation to allow the flow of hydrocarbons into the wellbore. The process is typically regulated by state oil and gas commissions. However, the EPA and other federal agencies have asserted federal regulatory authority over certain aspects of hydraulic fracturing activities, as outlined below.
The EPA has authority to regulate underground injections that contain diesel in the fluid system under the Safe Drinking Water Act. The EPA also has authority under the Clean Water Act to regulate wastewater generated by unconventional oil and gas operations during the hydraulic fracturing process and discharged to publicly-owned wastewater treatment facilities. If the EPA implements further regulations of hydraulic fracturing, we may incur additional costs to comply with such requirements that may be significant in nature,
experience delays or curtailment in the pursuit of exploration, development, or production activities, and could even be prohibited from drilling and/or completing certain wells.
Certain states, including Texas, have adopted, and other states are considering adopting, regulations that could impose more stringent permitting, public disclosure, waste disposal, and well construction requirements on hydraulic fracturing operations or otherwise seek to ban fracturing activities altogether. In addition to state laws, local land use restrictions, such as city ordinances, may restrict, or prohibit the performance of drilling in general and/or hydraulic fracturing in particular. Recently, municipalities have passed or proposed zoning ordinances that ban or strictly regulate hydraulic fracturing within city boundaries, setting the stage for challenges by state regulators and third-parties. Similar events and processes are playing out in several cities, counties, and townships across the United States. In the event that state, local, or municipal legal restrictions are adopted in areas where we are currently conducting, or in the future plan to conduct, operations, we may incur additional costs to comply with such requirements that may be significant in nature, experience delays or curtailment in the pursuit of exploration, development, or production activities, and could even be prohibited from drilling and/or completing certain wells.
In the recent past, several federal governmental agencies were actively involved in studies or reviews that focus on environmental aspects and impacts of hydraulic fracturing practices. Increased regulation and attention given to the hydraulic fracturing process could lead to greater opposition, including litigation, to oil and gas production activities using hydraulic fracturing techniques. Disclosure of chemicals used in the hydraulic fracturing process could make it easier for third parties opposing such activities to pursue legal proceedings against producers and service providers based on allegations that specific chemicals used in the fracturing process could adversely affect human health or the environment, including groundwater. In 2013, a court in California, and in 2020 the United States District Court for the District of Montana each held that the Bureau of Land Management (“BLM”) did not comply with the National Environmental Policy Act (“NEPA”) because it did not adequately consider the impact of hydraulic fracturing and horizontal drilling before issuing leases. In 2022, the federal Ninth Circuit Court of Appeals held that two federal agencies violated NEPA, in part, by failing to evaluate the environmental impacts of well stimulation treatments such as hydraulic fracturing before authorizing unconventional oil drilling offshore. Similar cases continue to be filed. In addition, courts in New York and Colorado reduced the level of evidence required before a court will agree to consider alleged damage claims from hydraulic fracturing by property owners. Litigation resulting in financial compensation for damages linked to hydraulic fracturing, including damages from induced seismicity, could spur future litigation and bring increased attention to the practice of hydraulic fracturing. Judicial decisions could also lead to increased regulation, permitting requirements, enforcement actions, and penalties. Additional legislation or regulation could also lead to operational delays or restrictions or increased costs in the exploration for, and production of, oil, gas, and NGLs, including from the development of shale plays, or could make it more difficult to perform hydraulic fracturing. The adoption of additional state or local laws, or the implementation of new regulations regarding hydraulic fracturing could potentially cause a decrease in the completion of new oil and gas wells, or an increase in compliance costs and delays, which could adversely affect our financial position, results of operations, and cash flows.
We will continue to be subject to uncertainty associated with new regulatory suspensions, revisions or rescissions and inconsistent state and federal regulatory mandates that could adversely affect our production.
Federal and state regulatory initiatives relating to air quality and greenhouse gas emissions could result in increased costs and additional operating restrictions or delays.
There has been a trend toward increased air quality and GHG regulation and reduced emissions from oil and gas sources. These regulations include the New Source Performance Standards (“NSPS”), the National Emission Standards for Hazardous Air Pollutants programs, and ozone standards set under the National Ambient Air Quality Standards (“NAAQS”), among others. The adoption of additional state or local laws, or the implementation of new regulations could potentially cause a decrease in the completion of new oil and gas wells, or an increase in compliance costs and delays, which could adversely affect our financial position, results of operations, and cash flows. Please refer to the Environmental section in Part II, Item 7 of this report for additional information about the regulation of air emissions, particularly methane emissions from the oil and gas sector.
Legislative and regulatory initiatives and litigation related to global warming and climate change could have an adverse effect on our operations and the demand for oil, gas, and NGLs, and could result in significant litigation and related expenses.
While courts have generally declined to assign direct liability for climate change to large sources of GHG emissions, some have required increased scrutiny of such emissions by federal agencies and permitting authorities. There is a continuing risk of claims being filed against companies that have significant GHG emissions, and new claims for damages and increased government scrutiny, especially from state and local governments, will likely continue.
The United States Congress has from time to time considered adopting legislation to reduce emissions of GHGs, and the majority of states have already taken measures to reduce emissions of GHGs through various measures, including, primarily through the planned development of GHG emission inventories, participation in and/or regional GHG “cap and trade” programs, and/or transition to clean energy. The focus on legislating and/or regulating methane could result in increased scrutiny for sources emitting high levels of methane, including during permitting processes, analysis, regulation and reduction of methane emissions as a requirement for project approval, and actions taken by one agency for a specific industry establishing precedents for other agencies and industry sectors. In 2021, the EPA proposed requirements for methane emission reductions from existing oil and gas equipment. In 2022, the EPA released
a supplemental proposal expanding its initial requirements as well as updating requirements to work in tandem with the programs included in the Inflation Reduction Act (“IRA”).
The IRA imposes fees on emissions of GHGs, including methane, exceeding applicable thresholds. This and any court rulings, laws, or regulations that restrict or require reduced emissions of GHGs or introduce new climate-related regulations such as a carbon pricing system, could have an adverse effect on demand for the oil and gas that we produce, and could lead to increased operating and compliance costs, and litigation costs, which could have a material adverse impact on our business. We have a long-term goal to reduce our Scope 1 and 2 GHG emissions intensity by 50 percent by 2030, compared with base year 2019 levels, and we have an annual goal to limit our methane emissions intensity at 0.04 (metric tonnes CH4/MBOE). Our GHG emissions in 2022 did not exceed the thresholds set forth by the IRA, however, there is no assurance that we will be able to meet our goals or that we will not exceed the thresholds set forth by the IRA in the future.
Scientists have predicted that increasing concentrations of GHGs in the earth’s atmosphere may produce climate changes that have significant physical effects, such as increased frequency and severity of storms, droughts, and floods and other climatic events. If such effects were to occur, our operations could be adversely affected. Potential adverse effects could include disruption of our drilling, completion, and production activities, including, for example, damages to our facilities from flooding or increases in our costs of operation or reductions in the efficiency of our operations, as well as potentially increased costs for insurance coverage in the aftermath of such events. Significant physical effects of climate change could also have an indirect effect on our financing and operations by disrupting the transportation or process-related services provided by midstream companies, service companies, or suppliers with whom we have a business relationship. We may not be able to recover through insurance some or any of the damages, losses, or costs that may result from potential physical effects of climate change. Federal regulations or policy changes regarding climate change preparation requirements could also impact our costs and planning requirements because emissions of such gases contribute to warming of the earth’s atmosphere and other climatic changes.
Requirements to reduce gas flaring could have an adverse effect on our operations.
In the Permian Basin in Texas, where we have significant operations, there have been, and could be in the future, constraints in gas takeaway capacity which has historically led to increased gas flaring. We are subject to laws established by state and other regulatory agencies that restrict the duration and amount of natural gas that can be legally flared. These laws and regulations, including potential future regulations that may impose further restrictions on flaring, could limit the amount of oil and gas we can produce from our wells or may limit the number of wells or the locations that we can drill. We have committed to a goal of zero routine flaring at all of our operated locations, and non-routine flaring not to exceed one percent of total gas production, each by 2023 based on the full year average. Additionally, we set annual targets to limit our flaring that are tied to compensation for all employees. There is no assurance that we will be able to meet our goals with respect to flaring and any failure to meet such goals could cause reputational or other harm to our business. Any future laws or commitments may increase our operational costs, or restrict our production, which could have a material adverse effect on our financial condition, results of operations and cash flows.
The impact of extreme weather conditions and lease stipulations adversely affect our ability to conduct drilling activities in some of the areas where we operate.
Our operations have been in the past, and may continue to be, adversely affected by the impact of extreme weather conditions. Additionally, lease stipulations designed to protect various wildlife or plant species may adversely impact our operations. In certain areas, drilling and other oil and gas activities can only be conducted during limited times of the year. This limits our ability to operate in those areas and can intensify competition during those times for drilling rigs and completion equipment, oil field equipment, services, supplies and qualified personnel, which may lead to periodic shortages. These constraints and the resulting shortages or high costs could delay our operations and materially increase our operating and capital costs.
Our ability to produce oil, gas, and NGLs economically and in commercial quantities could be impaired if we are unable to acquire adequate supplies of water for our drilling and/or completions operations or are unable to dispose of or recycle the water we produce at a reasonable cost and in accordance with applicable environmental rules.
The hydraulic fracturing process on which we and others in our industry depend to complete wells that will produce commercial quantities of oil, gas, and NGLs requires the use and disposal of significant quantities of water. Our inability to secure sufficient amounts of water, or to dispose of, or recycle, the water produced from our wells, could adversely impact our operations. Moreover, the imposition of new environmental initiatives and regulations could include restrictions on our ability to conduct certain operations such as hydraulic fracturing or disposal of wastes, including, but not limited to, produced water, drilling fluids, and other wastes associated with the exploration, development, or production of oil, gas, and NGLs.
Compliance with environmental regulations, surface use agreements, and permit requirements governing the withdrawal, storage, and use of surface water or groundwater necessary for hydraulic fracturing of wells may increase our operating costs and cause delays, interruptions, or termination of our operations, the extent of which cannot be predicted, all of which could have an adverse effect on our operations and financial condition.
Our ability to sell oil, gas, and NGLs, and/or receive market prices for our production, may be adversely affected by constraints on gathering systems, processing facilities, pipelines, and other transportation systems owned or operated by third-parties or by other interruptions beyond our control, which could obstruct, limit, or eliminate our access to oil, gas, and NGL markets.
The marketability of our oil, gas, and NGL production depends in part on the availability, proximity, and capacity of gathering systems, processing facilities, pipelines, and other transportation systems, which are generally owned or operated by third parties. Any significant interruption in service from, damage to, or lack of available capacity in these systems and facilities can result in the shutting-in of producing wells, the delay, or discontinuance of development plans for our properties, increases in costs, or lower price realizations. Although we have some influence over the processing and transportation of our operated production, material changes in these business relationships could materially affect our operations. Federal and state regulation of oil, gas, and NGL production and transportation, tax and energy policies, changes in supply and demand, pipeline pressures, damage to or destruction of pipelines or processing facilities, infrastructure or capacity constraints, and general economic conditions could adversely affect our ability to produce, gather, process, transport, or market oil, gas, and NGLs.
Production may be interrupted, or shut in, from time to time for numerous reasons, including weather conditions, accidents, loss of pipeline, gathering, processing or transportation system access or capacity, field labor issues or strikes, or we might voluntarily curtail production in response to market or other conditions. If a substantial amount of our production is interrupted at the same time, it could adversely affect our cash flows and results of operations.
We have entered into firm transportation contracts that require us to pay fixed sums of money to our counterparties regardless of quantities actually shipped, processed, or gathered. If we are unable to deliver the necessary quantities of oil, gas, NGL, or produced water to our counterparties, our results of operations, financial position, and liquidity could be adversely affected.
As of December 31, 2022, we were contractually committed to deliver a minimum of 18 MMBbl of oil through 2026, 26 Bcf of gas through the first half of 2023, and 11 MMBbl of produced water through 2027. We may enter into additional firm transportation agreements as we expand the development of our resource plays. We do not expect to incur any material shortfalls related to our existing contractual commitments. In the event we encounter delays in drilling and completing our wells or otherwise due to construction, interruptions of operations, or delays in connecting new volumes to gathering systems or pipelines for an extended period of time, or if we further limit our capital expenditures due to future commodity price declines or for other reasons, the requirements to pay for quantities not delivered could have a material impact on our results of operations, financial position, and liquidity.
If we are unable to replace reserves, we will not be able to sustain production.
Our future operations depend on our ability to find or acquire and develop oil, gas, and NGL reserves that are economically producible. Our properties produce oil, gas, and NGLs at a declining rate over time. In order to maintain current production rates, we must locate or acquire and develop new oil, gas, and NGL reserves to replace those being depleted by production.
For future acquisitions we may complete, a successful outcome for our business will depend on a number of factors, many of which are beyond our control. These factors include the purchase price and transaction costs for the acquisition, future oil, gas, and NGL prices, the ability to reasonably estimate the recoverable volumes of reserves, rates of future production and future net revenues attainable from reserves, future operating and capital costs, results of future exploration, exploitation, and development activities on the acquired properties, and future abandonment and possible future environmental or other liabilities. There are numerous uncertainties inherent in estimating these variables with respect to prospective acquisition targets. Actual results may vary substantially from those assumed in the estimates. Our customary review in connection with acquisitions will not necessarily reveal, or allow us to fully assess, all existing or potential problems and deficiencies with such properties. We do not inspect every well, and even when we inspect a well, we may not discover structural, subsurface, or environmental problems that may exist or arise. We may not be entitled to contractual indemnification for pre-closing liabilities, including environmental liabilities. We often acquire interests in properties on an “as-is” basis with limited remedies for breaches of representations and warranties.
Additionally, significant acquisitions can change the nature of our operations and business depending upon the character of the acquired properties if they have substantially different operating and geological characteristics or are in different geographic locations than our existing properties. To the extent that acquired properties are substantially different than our existing properties, our ability to efficiently realize the expected economic benefits of such transactions may be limited.
Integrating acquired businesses and properties involves a number of unique risks. These risks include the possibility that management may be distracted from regular business concerns by the need to integrate operations and systems and that unforeseen difficulties can arise in integrating operations and systems, and in retaining and assimilating employees. Any of these or other similar risks could lead to potential adverse short-term or long-term effects on our operating results and may cause us to not be able to realize any or all of the anticipated benefits of the acquisitions.
The results of our operations are subject to drilling and completion technique risks, and results may not meet our expectations for reserves or production. As a result, we may incur material write-downs, and the value of our undeveloped acreage could decline if drilling results are unsuccessful.
Many of our operations involve utilizing the latest drilling and completion techniques as developed by us, other operators and our service providers in order to maximize production and ultimate recoveries and therefore generate the highest possible returns. Risks we face while drilling include, but are not limited to, landing our well bore outside the desired drilling zone, deviating from the desired drilling zone while drilling horizontally through the formation, the inability to run our casing the entire length of the well bore, and the inability to run tools and recover equipment consistently through the horizontal well bore. Risks we face while completing our wells include, but are not limited to, the inability to fracture stimulate the planned number of stages, the inability to run tools and other equipment the entire length of the well bore during completion operations, the inability to recover such tools and other equipment, and the inability to successfully clean out the well bore after completion of the final fracture stimulation.
In addition, exploration and drilling technologies we currently use or implement in the future may become obsolete. If we are unable to maintain technological advancements consistent with industry standards, our operations and financial condition may be adversely affected. We cannot be certain we will be able to implement exploration and drilling technologies on a timely basis or at a cost that is acceptable to us.
Ultimately, the success of exploration, drilling, and completion technologies and techniques can only be evaluated over time as more wells are drilled and production profiles are established over a sufficiently long time period. If our drilling results are less than anticipated or we are unable to execute our drilling program because of capital constraints, lease expirations, limited access to gathering systems and takeaway capacity, and/or prices for oil, gas, and NGLs decline, then the return on our investment for a particular project may not be as attractive as we anticipated and we could incur material write-downs of oil and gas properties and the value of our undeveloped acreage could decline in the future.
Competition in our industry is intense, and many of our competitors have greater financial, technical, and human resources than we do.
We face intense competition from oil and gas exploration and production companies of all sizes for the capital, equipment, expertise, labor, and materials required to operate oil and gas properties. Many of our competitors have financial, technical, and other resources exceeding those available to us, and many oil and gas properties are sold in a competitive bidding process in which our competitors may be able and willing to pay more for exploratory and development prospects and productive properties, or in which our competitors have technological information or expertise that is not available to us to evaluate and successfully bid for properties. As a result, we may not be successful in acquiring and developing profitable properties. In addition, other companies may have a greater ability to continue drilling activities during periods of low oil or gas prices and to absorb the burden of current and future governmental regulations and taxation. In addition, shortages of equipment, labor, or materials as a result of intense competition may result in increased costs or the inability to obtain those resources as needed. Our inability to compete effectively with companies in any area of our business could have a material adverse impact on our business activities, financial condition, and results of operations.
The actual quantities and present value of our proved oil, gas, and NGL reserves may be less than we have estimated, and the cost to develop our reserves may be more than we have estimated.
This report and certain of our other SEC filings contain estimates of our proved oil, gas, and NGL reserves and the present value of estimated future net revenues from those reserves. The process of estimating reserves is complex and estimates are based on various assumptions, including geological and geophysical characteristics, future oil, gas, and NGL prices, drilling and completion costs, gathering and transportation costs, operating expenses, capital expenditures, effects of governmental regulation, taxes, timing of operations, and availability of funds. Therefore, these estimates are inherently imprecise. In addition, our reserve estimates for properties with limited production history may be less reliable than estimates for properties with lengthy production histories.
Actual future production; prices for oil, gas, and NGLs; revenues; production taxes; development expenditures; operating expenses; and quantities of producible oil, gas, and NGL reserves will most likely vary from those estimated. Any significant variance could materially affect the estimated quantities of and present value related to proved reserves disclosed by us, and the actual quantities and present value may be significantly less than what we have previously estimated. Our properties may also be susceptible to hydrocarbon drainage from production on adjacent properties, which we may not control.
As of December 31, 2022, 41 percent, or 219.6 MMBOE, of our estimated proved reserves were proved undeveloped. In order to develop our proved undeveloped reserves, as of December 31, 2022, we estimate approximately $2.8 billion of capital expenditures would be required. Although we have estimated our proved reserves and the costs associated with these proved reserves in accordance with industry standards, estimated costs may not be accurate, development may not occur as scheduled, and actual results may not occur as estimated.
One should not assume that the standardized measure of discounted future net cash flows or PV-10 included in this report represent the current market value of our estimated proved oil, gas, and NGL reserves. Management has based the estimated discounted future net cash flows from proved reserves on price and cost assumptions required by the SEC, whereas actual future prices and costs may be materially higher or lower. Please refer to Reserves in Part I, Items 1 and 2 of this report for discussion
regarding the prices used in estimating the present value of our proved reserves as of December 31, 2022, and to the caption Oil and Gas Reserve Quantities under Critical Accounting Estimates in Part II, Item 7 of this report for additional information.
The timing of production from oil and gas properties and of related expenses affects the timing of actual future net cash flows from proved reserves, and thus their actual present value. Our actual future net cash flows could be less than the estimated future net cash flows for purposes of computing PV-10. In addition, the 10 percent discount factor required by the SEC to calculate PV-10 for reporting purposes is not necessarily the most appropriate discount factor given actual interest rates, costs of capital, and other risks to which our business and the oil and gas industry in general are subject.
Our disposition activities may be subject to factors beyond our control, and in certain cases we may retain unforeseen liabilities for certain matters.
We regularly sell non-core assets in order to increase capital resources available for core assets and other purposes and to create organizational and operational efficiencies. We also occasionally sell interests in core assets for the purpose of accelerating the development and increasing efficiencies in other core assets. Various factors could materially affect our ability to dispose of such assets, including the approvals of governmental agencies or third parties, the availability of purchaser financing and purchasers willing to acquire the assets on terms we deem acceptable, or other matters or uncertainties that could impact such dispositions, including whether transactions could be consummated or completed in the form or timing and for the value that we anticipate. At times, we may be required to retain certain liabilities or agree to indemnify buyers in connection with such asset sales. The magnitude of such retained liabilities or of the indemnification obligations may be difficult to quantify at the time of the transaction and ultimately could be material.
We rely on third-party service providers to conduct drilling and completion and other related operations.
We rely on third-party service providers to perform necessary drilling and completion and other related operations. The ability of third-party service providers to perform such operations will depend on those service providers’ ability to compete for and retain qualified personnel, financial condition, economic performance, and access to capital, which in turn will depend upon the supply and demand for oil, gas, and NGLs, prevailing economic conditions, and financial, business, and other factors. Future periods of sustained low commodity prices could occur and could cause third-party service providers to consolidate or declare bankruptcy, which could limit our options for engaging such providers. The failure of a third-party service provider to adequately perform operations could delay drilling or completion or reduce production from the property and adversely affect our financial condition and results of operations. Our costs to retain third-party service providers increased during 2022 as a result of inflation, and continued inflation could result in additional cost increases.
Title to the properties in which we have an interest may be impaired by title defects.
We generally rely on title due diligence reports when acquiring oil and gas leasehold interests, and we obtain title opinions prior to commencing initial drilling operations on the properties we operate. Title to the properties in which we have an interest may be impaired by title defects that may not be identified in the due diligence title reports or title opinions we obtain, or such defects may not be cured following identification. A material title defect can reduce the value of a property or render it worthless, thus adversely affecting our oil and gas reserves, financial condition, results of operations, and operating cash flow, and may also impair the value of or render adjacent properties uneconomic to develop. Undeveloped acreage has greater risk of title defects than developed acreage and title insurance is not generally available for oil and gas properties.
Oil and gas drilling, completion, and production activities are subject to numerous risks, including the risk that no commercially producible oil, gas, or NGLs will be found.
The cost of drilling and completing wells is often uncertain, and oil, gas, or NGLs drilling and production activities may be shortened, delayed, or canceled as a result of a variety of factors, many of which are beyond our control. These factors may include, but are not limited to:
•supply chain issues, including cost increases and availability of equipment or materials;
•unexpected adverse drilling or completion conditions;
•title problems;
•disputes with owners or holders of surface interests on or near areas where we operate;
•pressure or geologic irregularities in formations;
•engineering and construction delays;
•equipment failures or accidents;
•hurricanes, tornadoes, flooding, wildfires or other adverse weather conditions;
•operational restrictions resulting from seismicity concerns;
•governmental permitting delays;
•compliance with environmental and other governmental requirements; and
•shortages or delays in the availability of or increases in the cost of drilling rigs and crews, fracture stimulation crews and equipment, pipe, chemicals, water, sand, and other supplies.
The wells we drill may not be productive, and we may not recover all or any portion of our investment in such wells. The seismic data and other technologies we use do not allow us to know conclusively prior to drilling a well if oil, gas, or NGLs are present, or whether they can be produced economically. Drilling activities can result in dry holes or wells that are productive but do not produce sufficient net revenues after operating and other costs to cover drilling and completion costs. Even if sufficient amounts of oil, gas, or NGLs exist, we may damage a potentially productive hydrocarbon-bearing formation or experience mechanical difficulties while drilling or completing a well, which could result in reduced or no production from the well, significant expenditure to repair the well, and/or the loss and abandonment of the well.
Another significant risk inherent in our drilling plans is the need to obtain drilling permits from state, local, and other governmental authorities. Delays in obtaining regulatory approvals and drilling permits, including delays that jeopardize our ability to realize the potential benefits from leased properties within the applicable lease periods, the failure to obtain a drilling permit for a well, or the receipt of a permit with unreasonable conditions or costs could have a material adverse effect on our ability to explore or develop our properties.
Results in newer resource plays may be more uncertain than results in resource plays that are more developed and have longer established production histories. We, and the industry, generally have less information with respect to the ultimate recoverability of reserves and the production decline rates in newer resource plays than other areas with longer histories of development and production. Drilling and completion techniques that have proven to be successful in other resource plays are being used in the early development of new plays; however, we can provide no assurance of the ultimate success of these drilling and completion techniques.
We may not be able to obtain any options or lease rights in potential drilling locations that we identify. Unless production is established within the spacing units covering undeveloped acres on which our drilling locations are identified, the leases for such acreage will expire, and we will lose our right to develop the related properties. Our total net acreage as of February 9, 2023, that is scheduled to expire over the next three years, represents less than one percent of our total net undeveloped acreage as of December 31, 2022. Although we have identified numerous potential drilling locations, we may not be able to economically drill for and produce oil, gas, or NGLs from all of them, and our actual drilling activities may materially differ from those presently identified, which could adversely affect our financial condition, results of operations and operating cash flow.
Many of our properties are in areas that may have been partially depleted or drained by offset wells and certain of our wells may be adversely affected by actions other operators may take when drilling, completing, or operating wells that they own.
Many of our properties are in areas that may have already been partially depleted or drained by earlier offset drilling. The owners of leasehold interests adjoining any of our properties could take actions, such as drilling and completing additional wells, which could adversely affect our operations. When a new well is completed and produced, the pressure differential in the vicinity of the well causes the migration of reservoir fluids toward the new wellbore (and potentially away from existing wellbores). As a result, the drilling and production of these potential locations could cause a depletion of our proved reserves and may inhibit our ability to further develop our proved reserves. In addition, completion operations and other activities conducted on adjacent or nearby wells could cause production from our wells to be shut in for indefinite periods of time, result in increased lease operating expenses and adversely affect the production and reserves from our wells after they re-commence production. We have no control over the operations or activities of offsetting operators.
The inability of customers or co-owners of assets to meet their obligations may adversely affect our financial results.
Substantially all of our accounts receivable result from oil, gas, and NGL sales or joint interest billings to co-owners of oil and gas properties we operate. This concentration of customers and joint interest owners may impact our overall credit risk because these entities may be similarly affected by various economic and other market conditions, including declines in oil, gas, and NGL prices. The loss of one or more of these customers could reduce competition for our products and negatively impact the prices of commodities we sell. We do not believe the loss of any single purchaser would materially impact our operating results, as we have numerous options for purchasers in each of our operating areas for our oil, gas, and NGL production. Please refer to Concentration of Credit Risk and Major Customers in Note 1 – Summary of Significant Accounting Policies, in Part II, Item 8 of this report for further discussion of our concentration of credit risk and major customers. Additionally, the inability of our co-owners to pay joint interest billings could negatively impact our cash flows and financial ability to drill and complete current and future wells.
We are subject to operating and environmental risks and hazards that could result in substantial losses or liabilities that may not be fully insured.
Oil and gas operations are subject to many risks, including human error and accidents, that could cause personal injury, death, property damage, well blowouts, craterings, explosions, uncontrollable flows of oil, gas and NGLs, or well fluids, releases or spills of completion fluids, spills or releases from facilities and equipment used to deliver or store these materials, spills or releases of brine or other produced or flowback water, subsurface conditions that prevent us from stimulating the planned number of completion stages, accessing the entirety of the wellbore with our tools during completion, or removing materials from the wellbore to allow production to
begin, fires, adverse weather such as hurricanes or tornadoes, freezing conditions, wildfires, floods, droughts, formations with abnormal pressures, pipeline ruptures or spills, pollution, seismic events, releases of toxic gas such as hydrogen sulfide, and other environmental risks and hazards. If any of these types of events occur, we could sustain substantial losses.
In response to increased seismic activity in the Permian Basin in Texas, the Railroad Commission of Texas (“RRC”) has developed a seismic review process for injection wells near qualifying seismic activity. As a result of the seismic review process, the RRC may declare an area to be a Seismic Response Area (“SRA”) and may adjust limits for injection rates and pressure, require bottom-hole pressure tests, or modify, suspend, or terminate injection well permits within the SRA. If an SRA is declared within an area of our operations, our ability to dispose of produced water may be adversely affected, and as a result, we may be forced to shut-in injection wells or find alternate produced water disposal options which could affect production and therefore oil, gas, and NGL production revenue, and could cause us to incur additional capital or operating expense. The declaration of SRAs has required us to adjust the areas where we seek permits for injection wells to areas or formations that are less desirable, and could further restrict the areas where we are able to obtain and operate under such permits without restrictions. Additionally, we could be subject to third-party claims and liability based on allegations that our operations caused or contributed to seismic events that resulted in damage to property or personal injury, or that are otherwise related to seismic events.
If we experience any of the problems with well stimulation, completion activities, and disposal referenced above, our ability to explore for and produce oil, gas, and NGLs may be adversely affected. We could incur substantial losses or otherwise fail to realize reserves in particular formations as a result of the need to shut down, abandon, or relocate drilling operations, the need to modify drill sites to lessen the risk of spills or releases, the need to investigate and/or remediate any spills, releases or ground water contamination that might have occurred, and the need to suspend our operations.
There is inherent risk of incurring significant environmental costs and liabilities in our operations due to our current and past generation, handling, and disposal of materials, including produced water, solid and hazardous wastes, and petroleum hydrocarbons. We may incur joint and several, and/or strict liability under applicable United States federal and state environmental laws in connection with releases of hazardous substances at, on, under, or from our leased or owned properties, some of which have been used for oil and gas exploration and production activities for a number of years, often by third-parties not under our control. For our outside-operated properties, we are dependent on the operator for operational and regulatory compliance and could be subject to liabilities in the event of non-compliance. These properties and the wastes disposed thereon or therefrom could be subject to stringent and costly investigatory or remedial requirements under applicable laws, some of which are strict liability laws without regard to fault or the legality of the original conduct, including CERCLA or the Superfund law, RCRA, the Clean Water Act, the CAA, the OPA, and analogous state laws. Under various implementing regulations, we could be required to remove or remediate previously disposed wastes (including wastes disposed of or released by prior owners or operators) or property contamination (including groundwater contamination), to perform natural resource mitigation or restoration practices, or to perform remedial plugging or closure operations to prevent future contamination. In addition, it is not uncommon for neighboring landowners and other third-parties to file claims for personal injury or property damage, including induced seismicity damage, allegedly caused by the release of petroleum hydrocarbons or other hazardous substances into the environment. As a result, we may incur substantial liabilities to third-parties or governmental entities, which could reduce or eliminate funds available for exploration, development, or acquisitions, or cause us to incur losses.
We maintain insurance against some, but not all, of these potential risks and losses. We have significant but limited coverage for sudden environmental damage. We do not believe that insurance coverage for the full potential liability that could be caused by environmental damage that occurs gradually over time is appropriate for us at this time given the nature of our operations and the nature and cost of such coverage. Further, we may elect not to obtain insurance coverage under circumstances where we believe that the cost of available insurance is excessive relative to the risks to which we are subject. Accordingly, we may be subject to liability or may lose substantial assets in the event of environmental or other damages. If a significant accident or other event occurs and is not fully covered by insurance, we could suffer an uninsured material loss.
We have limited control over the activities on properties we do not operate.
Some of our properties are operated by other companies and involve third-party working interest owners. As a result, we have limited ability to influence or control the operation or future development of such properties, including the nature and timing of drilling and operational activities, the operator’s skill and expertise, compliance with environmental, safety and other regulations, the approval of other participants in such properties, the selection and application of suitable technology, or the amount of expenditures that we will be required to fund with respect to such properties. Moreover, we are dependent on the other working interest owners of such projects to fund their contractual share of the expenditures of such properties. These limitations and our dependence on the operator and other working interest owners in these projects could cause us to incur unexpected future costs.
Risks Related to Debt, Liquidity, and Access to Capital
Lower oil, gas, or NGL prices could limit our ability to borrow under our Credit Agreement.
As of December 31, 2022, the borrowing base and aggregate lender commitments under our Credit Agreement were $2.5 billion and $1.25 billion, respectively. The borrowing base is subject to semi-annual redetermination based on the bank group’s assessment of the value of our proved reserves, which in turn is impacted by oil, gas, and NGL prices. The next borrowing base
redetermination date is scheduled for April 1, 2023. Divestitures of additional properties, incurrence of additional debt, or declines in commodity prices could limit our borrowing base and reduce the amount we can borrow under our Credit Agreement, which could in turn impact, among other things, our ability to service our debt, fund our capital program, or compete for the acquisition of new properties.
Substantial capital is required to develop and replace our reserves.
We must make substantial capital expenditures to find, acquire, develop, and produce oil, gas, and NGL reserves. Future cash flows and the availability of financing are subject to a number of factors, such as the level of production from existing wells, prices received for oil, gas, and NGL sales, our success in locating, developing, and acquiring new reserves, and the orderly functioning of credit and capital markets. If our cash flows from operations are less than expected, we may reduce our planned capital expenditures. If we cannot access sufficient liquidity under our Credit Agreement, or raise additional funds through debt or equity financing or the sale of assets, our ability to execute development plans, replace our reserves, maintain our acreage, or maintain production levels could be greatly limited.
Downgrades in our credit ratings by various credit rating agencies could impact our access to capital and have a material adverse effect on our business and financial condition.
Downgrades of our credit rating levels could have material adverse consequences on our business and future prospects and could:
•limit our ability to access capital markets, including for the purpose of refinancing our existing debt;
•cause us to refinance or issue debt with less favorable terms and conditions, which debt may restrict, among other things, our ability to make any dividend distributions or repurchase shares;
•negatively impact lenders’ willingness to transact business with us, which could impact our ability to obtain favorable terms and conditions under our Credit Agreement;
•negatively impact current and prospective customers’ willingness to transact business with us;
•impose additional insurance, guarantee, bonding, and collateral requirements;
•limit our access to bank and third-party guarantees, surety bonds, and letters of credit; and
•cause our suppliers and financial institutions to lower or eliminate the level of credit provided through payment terms or intraday funding when dealing with us, thereby increasing the need for higher levels of cash on hand, which would decrease our ability to repay outstanding indebtedness.
We cannot provide assurance that any of our current credit ratings will remain in effect for any given period of time or that a credit rating will not be lowered or withdrawn entirely by a rating agency if, in its judgment, circumstances warrant.
Our commodity derivative contract activities may result in financial losses or may limit the prices we receive for oil, gas, and NGL sales.
To mitigate a portion of the exposure to potentially adverse market changes in oil, gas, and NGL prices and the associated impact on cash flows, we regularly enter into commodity derivative contracts. Our commodity derivative contracts typically include price swap and collar arrangements for oil, gas, and NGLs. These activities may expose us to the risk of financial loss in certain circumstances, including instances in which:
•our production is less than expected;
•one or more counterparties to our commodity derivative contracts default on their contractual obligations; or
•there is a widening of price differentials between delivery points for our production and the delivery point assumed in the commodity derivative contract arrangement.
In addition, commodity derivative contracts may limit the prices we receive for our oil, gas, and NGL sales if oil, gas, or NGL prices rise substantially over the price established by the commodity derivative contract, which we experienced in 2022. Please refer to Note 10 – Derivative Financial Instruments in Part II, Item 8 of this report for additional detail regarding our commodity derivative contracts.
The amount of our debt may limit our ability to obtain financing for acquisitions, make us more vulnerable to adverse economic conditions, and make it more difficult for us to make payments on our debt.
As of December 31, 2022, we had $1.6 billion of aggregate principal amount outstanding of Senior Notes with maturities through 2028, as further discussed and defined in Note 5 – Long-Term Debt in Part II, Item 8 of this report. Additionally, we had no outstanding balance on our revolving credit facility and $1.2 billion of available borrowing capacity under our Credit Agreement as of December 31, 2022. Our long-term debt represented 34 percent of our total book capitalization as of December 31, 2022.
The amounts of our indebtedness could have important consequences for our operations, including:
•making it more difficult for us to obtain additional financing in the future for our operations and potential acquisitions, working capital requirements, capital expenditures, debt service, or other general corporate requirements;
•requiring us to dedicate a substantial portion of our cash flows from operations to the repayment of our debt and the service of interest costs associated with our debt, rather than to capital investments;
•limiting our operating flexibility due to financial and other restrictive covenants, including restrictions on incurring additional debt, making acquisitions, and paying dividends;
•placing us at a competitive disadvantage compared to our competitors with less debt; and
•making us more vulnerable in the event of adverse economic or industry conditions or a downturn in our business.
If our business does not generate sufficient cash flow from operations or future sufficient borrowings are not available to us under our Credit Agreement or from other sources, we might not be able to service our debt, issue additional debt, or fund our planned capital expenditures and other liquidity needs. If we are unable to service our debt, due to inadequate liquidity or otherwise, we may have to delay or cancel acquisitions, defer capital expenditures, sell equity securities, divest assets, and/or restructure or refinance our debt. We might not be able to sell our equity, sell our assets, or restructure or refinance our debt on a timely basis or on satisfactory terms or at all. In addition, the terms of our existing or future debt agreements, including our Credit Agreement and any future credit agreements, may prohibit us from pursuing any of these alternatives.
As discussed above, our Credit Agreement is subject to periodic borrowing base redeterminations. At times when we have an outstanding balance, we could be forced to repay a portion of our bank borrowings in the event of a downward redetermination of our borrowing base, and we may not have sufficient funds to make such repayment at that time. If we do not have sufficient funds and are otherwise unable to negotiate adjustments to our borrowing base or arrange new financing, we may be forced to sell significant assets.
The agreements governing our debt arrangements contain various covenants that limit our discretion in the operation of our business, could prohibit us from engaging in transactions we believe to be beneficial, and could lead to the accelerated repayment of our debt.
Our debt agreements, including our Credit Agreement and the indentures governing our Senior Notes, contain restrictive covenants that limit our ability to engage in activities that may be in our long-term best interests, including restrictions on incurring debt, issuing dividends, repurchasing common stock, selling assets, creating liens, entering into transactions with affiliates, and merging, consolidating, or selling our assets. Our ability to borrow under our Credit Agreement is subject to compliance with certain financial and non-financial covenants, as outlined in the Credit Agreement. Please refer to Note 5 – Long-Term Debt in Part II, Item 8 of this report for additional discussion. These restrictions on our ability to operate our business could significantly harm us by, among other things, limiting our ability to take advantage of financings, mergers and acquisitions, and other corporate opportunities.
Our failure to comply with these covenants could result in an event of default that, if not cured or waived, could result in the acceleration of all or a portion of our indebtedness. We do not have sufficient working capital to satisfy our debt obligations in the event of an acceleration of all or a significant portion of our outstanding indebtedness.
Negative public perception and investor sentiment regarding our business and the oil and gas industry as a whole could adversely affect our business, operations, and our ability to attract capital.
Certain segments of the public as a whole, and the investment community in particular, have developed negative sentiment toward our industry. In recent years, equity returns in the sector versus other industry sectors have led to lower oil and gas representation in certain key equity market indices. In addition, some investors, including investment management firms, sovereign wealth and pension funds, university endowments and other investment advisors, have adopted policies to discontinue or reduce their investments in the oil and gas sector based on social and environmental considerations. Furthermore, other influential stakeholders have pressured commercial and investment banks and other service providers to reduce or cease financing of oil and gas companies and related infrastructure projects.
Such developments, including increased focus on environmental, social and governance matters and initiatives aimed at limiting climate change and reducing air pollution, and changes in federal income tax laws could result in downward pressure on the stock prices of oil and gas companies, including ours. This may also potentially result in a reduction of available capital funding for potential development projects, impacting our future financial results.
Risks Related to Corporate Governance and Ownership of Public Equity Securities
Our certificate of incorporation and by-laws have provisions that discourage corporate takeovers and could prevent stockholders from receiving a takeover premium on their investment, which could adversely affect the price of our common stock.
Delaware corporate law and our certificate of incorporation and by-laws contain provisions that may have the effect of delaying or preventing a change of control of us or our management. These provisions, among other things, provide for non-cumulative voting in
the election of members of the Board of Directors and impose procedural requirements on stockholders who wish to make nominations for the election of directors or propose other actions at stockholder meetings. These provisions, alone or in combination with each other, may discourage transactions involving actual or potential changes of control, including transactions that otherwise could involve payment of a premium over prevailing market prices to stockholders for their common stock. As a result, these provisions could make it more difficult for a third party to acquire us, even if doing so would benefit our stockholders, which may limit the price investors are willing to pay in the future for shares of our common stock.
In addition, stockholder activism in our industry has been present in recent years, and if investors seek to exert influence or affect changes to our business that we do not believe are in the long-term best interests of our stockholders, such actions could adversely impact our business by, among other things, distracting our Board of Directors and management team, causing us to incur unexpected advisory fees and other related costs, impacting execution of our strategic objectives, and creating unnecessary market uncertainty.
The price of our common stock may fluctuate significantly, which may result in losses for investors.
From January 1, 2022, to February 9, 2023, the intraday trading prices per share of our common stock as reported by the New York Stock Exchange ranged from a low of $28.91 per share in January 2022 to a high of $54.97 per share in June 2022. We expect our stock to continue to be subject to fluctuations as a result of a variety of factors, including factors beyond our control. These factors include, in addition to the other risk factors set forth herein, the following:
•changes in oil, gas, or NGL prices;
•changes in the outlook for regional, national, or global commodity supply and demand;
•variations in drilling, recompletion, and operating activity;
•inflation;
•changes in financial estimates by securities analysts;
•changes in market valuations of comparable companies;
•additions or departures of key personnel;
•increased volatility due to the impacts of algorithmic trading practices;
•future sales of our common stock;
•negative public perception and investor sentiment regarding our business and the oil and gas industry as a whole;
•changes in the national and global economic outlook, including potential impacts from trade agreements; and
•international trade relationships, potentially including the effects of trade restrictions or tariffs affecting the raw materials we utilize and the commodities we produce in our business.
We may not meet the expectations of our stockholders and/or of securities analysts at some time in the future, and our stock price could decline as a result.
We may not always pay dividends on our common stock or repurchase common stock under our Stock Repurchase Program.
Payment of future dividends remains at the discretion of our Board of Directors, and common stock repurchases under our Stock Repurchase Program remain at the discretion of our Board of Directors and certain authorized officers of the Company. Decisions regarding the payment of dividends and the repurchase of common stock will continue to depend on our earnings, capital requirements, financial condition, general market and economic conditions, applicable legal requirements, the market price of our common stock, and other factors. The payment of dividends and the repurchase of our common stock are each subject to covenants in our Credit Agreement and in the indentures governing our Senior Notes that could limit our ability to make certain restricted payments including dividends and common stock repurchases. Our Board of Directors may determine in the future to reduce the current annual dividend rate or discontinue the payment of dividends altogether. The value of shares authorized for repurchase by the Board of Directors does not require us to repurchase such shares or guarantee that such shares will be repurchased, and the Stock Repurchase Program may be suspended, modified, or discontinued at any time without prior notice. No assurance can be given that any particular number or dollar value of our shares will be repurchased.
General Risk Factors
Our increasing dependence on digital technologies puts us at risk for a cyber incident that could result in information theft, data corruption, operational disruptions or financial loss.
We are subject to cybersecurity risks. The oil and gas industry is increasingly dependent on digital technology in all aspects of our business. We use digital technology to conduct certain aspects of our drilling development, production and gathering activities, manage drilling rigs and completion equipment, gather and interpret seismic data, conduct reservoir modeling, record financial and operating data, and maintain employee and other databases. Our service providers, including those who gather, process, and market our oil, gas, and NGLs, are also increasingly reliant on digital technology. Our and their reliance on this technology increasingly puts us
at risk for technology system failures, data or network disruptions, cyberattacks and other breaches in cybersecurity. Power failures, telecommunication or other system failures due to hardware or software malfunctions, computer viruses, vandalism, terrorism, natural disasters, fire, flood, human error or other means could significantly impair our ability to conduct our business.
Cybersecurity attacks are evolving and include, but are not limited to, malicious software, attempts to gain unauthorized access to data, cash, or other assets, and other electronic security breaches that could lead to disruptions in critical systems, unauthorized release of confidential or otherwise protected information, and corruption of data. Deliberate attacks on, or security breaches in our systems, infrastructure, the systems and infrastructure of third-parties, or cloud-based applications could lead to disclosure of confidential information, a corruption or loss of our proprietary data, delays in production or exploration activities, difficulty in completing or settling transactions, challenges in maintaining our books and records, environmental damage, communication or other operational disruptions, and liability to third parties. Any insurance we might obtain in the future may not provide adequate protection from these risks. Any such events could damage our reputation and lead to financial losses from remedial actions, loss of business or potential liability. As these cyber risks continue to evolve and our dependence on digital technologies grows, we may be required to expend significant additional resources to continue to modify or enhance our protective measures and remediate cyber vulnerabilities.
The Audit Committee of our Board of Directors receives a quarterly cybersecurity report and update from management, discusses any relevant issues related thereto, and generally oversees and contributes to our Board of Director’s understanding of information technology and cybersecurity risks, among others that may be relevant at any given time. Upon the recommendation of the Audit Committee, we have taken a preventative approach with respect to cybersecurity threats by building a resilient cybersecurity culture through training and other forms of awareness for our employees and by creating and testing various response plans to hypothetical cybersecurity attacks to quickly assess and respond to potential and actual threats. We did not experience any material cybersecurity incidents during 2022, however there can be no assurance that the measures we have taken to address information technology and cybersecurity risks will prove effective in the future.
Our business could be negatively impacted by security threats, including cybersecurity threats, terrorism, armed conflict, and other disruptions.
As an oil, gas, and NGL producer, we face various security threats, including cybersecurity threats to gain unauthorized access to sensitive information or to render data or systems unusable; threats to the safety of our employees; threats to the security of our facilities and infrastructure or third-party facilities and infrastructure, such as processing plants and pipelines; and threats from terrorist acts. Although we utilize various procedures and controls to monitor these threats and mitigate our exposure to such threats, there can be no assurance that these procedures and controls will be sufficient in preventing security threats from materializing. If any of these events were to materialize, they could lead to losses of sensitive information, critical infrastructure, personnel, or capabilities essential to our operations and could have a material adverse effect on our reputation, financial position, results of operations, or cash flows.
The threat of terrorism and the impact of military and other actions have caused instability in world financial markets and could lead to increased volatility in prices for oil, gas, and NGLs, all of which could adversely affect the markets for our production. Energy assets might be specific targets of terrorist attacks. While we currently maintain insurance that provides limited coverage against terrorist attacks, such insurance has become increasingly expensive and difficult to obtain. As a result, insurance providers may not continue to offer this coverage to us on terms we consider reasonable, or at all. In addition, this insurance may not cover all of our losses for a terrorist attack. These developments have subjected our operations to increased risk and, depending on their occurrence and ultimate magnitude, could have a material adverse effect on our business, financial condition, or results of operations.
ITEM 1B. UNRESOLVED STAFF COMMENTS
We have no unresolved comments from the SEC staff regarding our periodic or current reports under the Exchange Act.
ITEM 3. LEGAL PROCEEDINGS
At times, we may be involved in litigation relating to claims arising out of our business and operations in the normal course of business. As of the filing of this report, no legal proceedings are pending against us that we believe individually or collectively are likely to have a material adverse effect upon our financial condition, results of operations, or cash flows.
ITEM 4. MINE SAFETY DISCLOSURES
These disclosures are not applicable to us.
PART II
ITEM 5. MARKET FOR REGISTRANT’S COMMON EQUITY, RELATED STOCKHOLDER MATTERS, AND ISSUER PURCHASES OF EQUITY SECURITIES
Our common stock is currently traded on the New York Stock Exchange under the ticker symbol “SM.” For dividend information, please refer to the caption Uses of Cash in Overview of Liquidity and Capital Resources in Item 7 of this report. Information regarding the SM Energy Equity Incentive Compensation Plan, as amended and restated effective as of May 22, 2018 (the “Equity Plan”), and the securities authorized under the Equity Plan is included below.
PERFORMANCE GRAPH
The following performance graph compares the cumulative return on our common stock, for the period beginning December 31, 2017, and ending December 31, 2022, with the cumulative total returns of the Dow Jones Exploration and Production Index (“DJUSOS”), and the Standard & Poor’s 500 Stock Index (“SPX”).
COMPARISON OF 5-YEAR CUMULATIVE TOTAL RETURNS
The preceding information under the caption Performance Graph shall be deemed to be furnished, but not filed with the SEC.
Holders. As of February 9, 2023, the number of record holders of our common stock was 102. A substantially greater number of holders of our common stock are beneficial holders, whose shares of record are held by banks, brokers, and other financial institutions.
Purchases of Equity Securities by Issuer and Affiliated Purchasers. The following table provides information about purchases made by us and any affiliated purchaser (as defined in Rule 10b-18(a)(3) under the Exchange Act) during the indicated quarters and months, and the year ended December 31, 2022, of shares of our common stock, which is the sole class of equity securities registered by us pursuant to Section 12 of the Exchange Act:
| | | | | | | | | | | | | | | | | | |
| PURCHASES OF EQUITY SECURITIES BY ISSUER AND AFFILIATED PURCHASERS |
| Period | | Total Number of Shares Purchased (1) | | Weighted Average Price Paid per Share | | Total Number of Shares Purchased as Part of Publicly Announced Program (2) | | Maximum Number or Approximate Dollar Value of Shares that May Yet Be Purchased Under the Program (as of the period end date) (2)(3) |
First quarter of 2022 | | 623 | | | $ | 38.02 | | | — | | | 3,072,184 | |
Second quarter of 2022 | | — | | | $ | — | | | — | | | 3,072,184 | |
Third quarter of 2022 | | 1,086,021 | | | $ | 41.75 | | | 452,734 | | | $ | 479,767,724 | |
| 10/01/2022 - 10/31/2022 | | — | | | $ | — | | | — | | | $ | 479,767,724 | |
| 11/01/2022 - 11/30/2022 | | 362,521 | | | $ | 44.07 | | | 362,521 | | | $ | 463,792,716 | |
| 12/01/2022 - 12/31/2022 | | 550,000 | | | $ | 38.13 | | | 550,000 | | | $ | 442,820,671 | |
| Total | | 1,999,165 | | | $ | 41.17 | | | 1,365,255 | | | |
____________________________________________
(1)633,910 shares purchased by us in 2022 were to offset tax withholding obligations that occurred upon the delivery of outstanding shares underlying Restricted Stock Units (“RSU” or “RSUs”) and Performance Share Units (“PSU” or “PSUs”) issued under the terms of award agreements granted under the Equity Plan.
(2)On September 7, 2022, we announced that our Board of Directors approved the Stock Repurchase Program authorizing us to repurchase up to $500.0 million in aggregate value of our common stock through December 31, 2024. The Stock Repurchase Program permits us to repurchase our shares from time to time in open market transactions, through privately negotiated transactions or by other means in accordance with federal securities laws and subject to certain provisions of our Credit Agreement and the indentures governing our Senior Notes. We intend to fund repurchases with net cash provided by operating activities. Stock repurchases may also be funded with borrowings under our Credit Agreement. The timing, as well as the number and value of shares repurchased under the Stock Repurchase Program, will be determined by certain authorized officers of the Company at their discretion and will depend on a variety of factors, including the market price of our common stock, general market and economic conditions and applicable legal requirements. The value of shares authorized for repurchase by our Board of Directors does not require us to repurchase such shares or guarantee that such shares will be repurchased, and the Stock Repurchase Program may be suspended, modified, or discontinued at any time without prior notice. No assurance can be given that any particular number or dollar value of our shares will be repurchased. During the year ended December 31, 2022, we repurchased and subsequently retired 1,365,255 shares of our common stock under the Stock Repurchase Program at a weighted-average share price of $41.88 for a total cost of $57.2 million, excluding commissions and fees.
(3)The Stock Repurchase Program terminates and supersedes the August 1998 authorization to repurchase common stock, under which 3,072,184 shares remained available for repurchase prior to termination.
Our payment of cash dividends to our stockholders and repurchases of our common stock are each subject to certain covenants under the terms of our Credit Agreement and Senior Notes. Based on our current performance, we do not anticipate that any of these covenants will limit our potential repurchases of our common stock or our payment of dividends at our current rate for the foreseeable future if any dividends are declared by our Board of Directors.
ITEM 6. [RESERVED]
ITEM 7. MANAGEMENT’S DISCUSSION AND ANALYSIS OF FINANCIAL CONDITION AND RESULTS OF OPERATIONS
The following discussion includes forward-looking statements. Please refer to the Cautionary Information about Forward-Looking Statements section of this report for important information about these types of statements.
Overview of the Company
General Overview
Our strategy is to be a premier operator of top-tier oil and gas assets. Our team executes this strategy by prioritizing safety, technological innovation, and stewardship of natural resources, all of which are integral to our corporate culture. Our purpose is to make people’s lives better by responsibly producing energy supplies, contributing to domestic energy security and prosperity, and having a positive impact in the communities where we live and work. Our long-term vision is to sustainably grow value for all of our stakeholders by maintaining and optimizing our high-quality asset portfolio, generating cash flows, and maintaining a strong balance sheet. Our near-term goals include returning value to stockholders through our Stock Repurchase Program and fixed dividend payments, which increased during 2022.
Our asset portfolio is comprised of high-quality assets in the Midland Basin of West Texas and in the Maverick Basin of South Texas that are capable of generating strong returns in the current macroeconomic environment, and present resilience to commodity price risk. We remain focused on maximizing returns and increasing the value of our top-tier assets through continued development and optimization of our Midland Basin assets and through continued delineation of the Austin Chalk formation in South Texas. We believe that our high-quality asset base provides for a sustainable and repeatable approach to prioritizing operational execution, maintaining strong cash flows, returning capital to stockholders, continuing to improve leverage metrics, and maintaining strong financial flexibility.
We are committed to exceptional safety, health, and environmental stewardship; supporting the professional development of a diverse and thriving team of employees; building and maintaining partnerships with our stakeholders by investing in and connecting with the communities where we live and work; and transparency in reporting our progress in these areas. The Environmental, Social and Governance Committee of our Board of Directors oversees, among other things, the development and implementation of the Company’s ESG policies, programs and initiatives, and, together with management, reports to our Board of Directors regarding such matters. Further demonstrating our commitment to sustainable operations and environmental stewardship, compensation for our executives and eligible employees under our long-term incentive plan, and compensation for all employees under our short-term incentive plan is calculated based on, in part, certain Company-wide, performance-based metrics that include key financial, operational, and environmental, health, and safety measures. Please refer to our Definitive Proxy Statement on Schedule 14A for the 2023 annual meeting of stockholders to be filed within 120 days from December 31, 2022, for additional discussion.
Global commodity and financial markets remain subject to high levels of macroeconomic uncertainty and volatility as a result of inflation, the ongoing conflict between Russia and Ukraine and associated economic and trade sanctions on Russia, and the Pandemic. These events have been drivers of volatile commodity prices and contributed to increased service provider costs, instances of supply chain disruptions, and a rise in interest rates, and could have further industry-specific impacts that may require us to adjust our business plan. Future impacts of these and other events on commodity and financial markets are inherently unpredictable. Despite continuing uncertainty, we expect to maximize the value of our high-quality asset base and sustain strong operational performance and financial stability. We are focused on returning capital to shareholders through increasing returns and cash flow generation.
2022 Financial and Operational Highlights
During 2022, we accomplished the near-term goals established at the beginning of the year to improve our leverage metrics by reducing the principal balance of our outstanding debt through cash flow generation and increasing the value of our capital project inventory. For the year ended December 31, 2022, net cash provided by operating activities exceeded net cash used in investing activities by $806.1 million, and we reduced the principal balance of our total outstanding long-term debt by $551.4 million by redeeming the remaining outstanding aggregate principal balance of our 2024 Senior Notes and our 2025 Senior Secured Notes. Our Board of Directors authorized the Stock Repurchase Program and increased our fixed dividend to $0.60 per share annually, to be paid in quarterly increments of $0.15 per share, both of which align with our goal to implement a sustainable and repeatable capital return program that creates long-term value for our stockholders. During the year ended December 31, 2022, we repurchased and subsequently retired 1,365,255 shares of our common stock at a cost of $57.2 million. Please refer to Note 3 - Equity and Note 5 – Long-Term Debt in Part II, Item 8 of this report for additional discussion and definitions.
Financial and Operational Results. Average net daily equivalent production for the year ended December 31, 2022, increased three percent to 145.1 MBOE, compared with 140.7 MBOE for 2021. The total increase consisted of a 37 percent increase from our South Texas assets, which outpaced a 14 percent decrease from our Midland Basin assets, as a result of increased capital allocation to our Austin Chalk assets. Realized prices for oil, gas, and NGLs increased 40 percent, 29 percent, and six percent, respectively, for the year ended December 31, 2022, compared with 2021. As a result of increased realized prices, oil, gas, and NGL production revenue increased 29 percent to $3.3 billion for the year ended December 31, 2022, compared with $2.6 billion for 2021. We recorded a net derivative loss of $374.0 million for the year ended December 31, 2022, compared with a $901.7 million net derivative loss for 2021.
These amounts include derivative settlement losses of $710.7 million and $749.0 million for the years ended December 31, 2022, and 2021, respectively. Operational activities during the year ended December 31, 2022, resulted in the following financial and operational results:
•Net cash provided by operating activities of $1.7 billion for the year ended December 31, 2022, compared with $1.2 billion for 2021.
•Net income of $1.1 billion, or $8.96 per diluted share, for the year ended December 31, 2022, compared with net income of $36.2 million, or $0.29 per diluted share for 2021.
•Adjusted EBITDAX, a non-GAAP financial measure, for the year ended December 31, 2022, of $1.9 billion, compared with $1.2 billion for 2021. Please refer to Non-GAAP Financial Measures below for additional discussion, including our definition of adjusted EBITDAX and reconciliations to net income (loss) and net cash provided by operating activities.
•Total estimated proved reserves as of December 31, 2022, increased nine percent from December 31, 2021, to 537.4 MMBOE, of which, 56 percent were liquids (oil and NGLs) and 59 percent were proved developed reserves. The increase to total estimated proved reserves was primarily driven by 103.2 MMBOE of infill reserves, partially offset by 53.0 MMBOE of production during 2022 and the removal of 19.9 MMBOE of proved undeveloped reserves reclassified to unproved reserves categories as a result of development plan optimization. Our proved reserve life index increased to 10.1 years as of December 31, 2022, compared with 9.6 years as of December 31, 2021. Please refer to Reserves in Part I, Items 1 and 2 of this report for additional discussion. The standardized measure of discounted future net cash flows was $10.0 billion as of December 31, 2022, compared with $7.0 billion as of December 31, 2021, which was an increase of 43 percent year-over-year. Please refer to Supplemental Oil and Gas Information (unaudited) in Part II, Item 8 of this report for additional discussion.
Operational Activities. During 2022, we continued to experience strong well performance in the RockStar area of our Midland Basin position due to successful operational execution, enhanced drilling and completion designs, and our focus on capital efficiency. Our South Texas program benefited from continued successful delineation and development of the Austin Chalk formation in addition to the sustained strong performance of our Eagle Ford shale wells. Our continued success in both our Midland Basin and South Texas programs is attributable to our top-tier assets and our continued commitment to geoscience, technology, and innovation.
Our Midland Basin program averaged three drilling rigs and one completion crew during 2022. We drilled 63 gross (50 net) wells and completed 44 gross (36 net) wells during 2022, and net equivalent production decreased year-over-year by 14 percent to 29.7 MMBOE. Costs incurred during 2022 totaled $476.2 million, or 50 percent of our total 2022 costs incurred. Drilling and completion activities within our RockStar and Sweetie Peck positions in the Midland Basin continue to focus primarily on developing the Spraberry and Wolfcamp formations.
Our South Texas program averaged two drilling rigs and one completion crew during 2022. We drilled 41 gross (40 net) wells and completed 43 gross (43 net) wells during 2022, and net equivalent production increased year-over-year by 37 percent to 23.2 MMBOE. Costs incurred during 2022 totaled $431.0 million, or 45 percent of our total 2022 costs incurred. Drilling and completion activities in South Texas during 2022 were primarily focused on developing the Austin Chalk formation.
The table below provides a summary of changes in our drilled but not completed well count and current year drilling and completion activity in our operated programs for the year ended December 31, 2022:
| | | | | | | | | | | | | | | | | | | | | | | | | | | | | | | | | | | |
| Midland Basin | | South Texas | | Total |
| Gross | | Net | | Gross | | Net | | Gross | | Net |
Wells drilled but not completed at December 31, 2021 (1) | 30 | | | 27 | | | 32 | | | 32 | | | 62 | | | 59 | |
Wells drilled (2) | 63 | | | 50 | | | 41 | | | 40 | | | 104 | | | 90 | |
Wells completed (2) | (44) | | | (36) | | | (43) | | | (43) | | | (87) | | | (79) | |
| | | | | | | | | | | |
Other (3) | — | | | — | | | (1) | | | (1) | | | (1) | | | (1) | |
Wells drilled but not completed at December 31, 2022 (4)(5) | 49 | | | 40 | | | 29 | | | 28 | | | 78 | | | 69 | |
____________________________________________
(1) The South Texas drilled but not completed well count as of December 31, 2021, included 11 gross (11 net) wells that were not included in our five-year development plan as of December 31, 2021, 10 of which were in the Eagle Ford shale.
(2) Wells drilled and completed during the year ended December 31, 2022, exclude one drilled and completed well that was subsequently abandoned, outside of our core areas of operation.
(3) In 2022, we drilled a science well to study and monitor Austin Chalk reservoir activity during and after development. We do not intend to complete this well.
(4) The South Texas drilled but not completed well count as of December 31, 2022, includes nine gross (nine net) wells that are not included in our five-year development plan, eight of which are in the Eagle Ford shale.
(5) Amounts may not calculate due to rounding.
Costs Incurred. Costs incurred in oil and gas property acquisition, exploration, and development activities, whether capitalized or expensed, are summarized as follows:
| | | | | |
| For the Year Ended |
| December 31, 2022 |
| (in millions) |
| Development costs | $ | 810.5 | |
| Exploration costs | 147.0 | |
| Acquisitions | |
| Proved properties | — | |
| Unproved properties | 4.2 | |
Total, including asset retirement obligations (1) | $ | 961.7 | |
____________________________________________
(1) Please refer to the caption Costs Incurred in Supplemental Oil and Gas Information (unaudited) in Part II, Item 8 of this report.
Production Results. The table below presents the disaggregation of our net production volumes by product type for each of our assets for the year ended December 31, 2022:
| | | | | | | | | | | | | | | | | |
| Midland Basin | | South Texas | | Total |
| Net production volumes: | | | | | |
| Oil (MMBbl) | 19.1 | | | 4.9 | | | 24.0 | |
| Gas (Bcf) | 63.5 | | | 62.5 | | | 125.9 | |
| NGLs (MMBbl) | — | | | 8.0 | | | 8.0 | |
| Equivalent (MMBOE) | 29.7 | | | 23.2 | | | 53.0 | |
| Average net daily equivalent (MBOE per day) | 81.4 | | | 63.7 | | | 145.1 | |
| Relative percentage | 56 | % | | 44 | % | | 100 | % |
____________________________________________
Note: Amounts may not calculate due to rounding.
Net equivalent production increased three percent for the year ended December 31, 2022, compared with 2021, comprised of a 37 percent increase from our South Texas assets, partially offset by a 14 percent decrease from our Midland Basin assets. Please refer to Overview of Selected Production and Financial Information, Including Trends and Comparison of Financial Results and Trends Between 2022 and 2021 and Between 2021 and 2020 below for additional discussion on production.
Oil, Gas, and NGL Prices
Our financial condition and the results of our operations are significantly affected by the prices we receive for our oil, gas, and NGL production, which can fluctuate dramatically. When we refer to realized oil, gas, and NGL prices below, the disclosed price represents the average price for the respective period, before the effect of derivative settlements. While quoted NYMEX oil and gas and OPIS NGL prices are generally used as a basis for comparison within our industry, the prices we receive are affected by quality, energy content, location and transportation differentials, and contracted pricing benchmarks for these products.
The following table summarizes commodity price data, as well as the effect of derivative settlements, for the years ended December 31, 2022, 2021, and 2020:
| | | | | | | | | | | | | | | | | |
| For the Years Ended December 31, |
| 2022 | | 2021 | | 2020 |
| Oil (per Bbl): | | | | | |
| Average NYMEX contract monthly price | $ | 94.23 | | | $ | 67.92 | | | $ | 39.40 | |
| Realized price | $ | 94.67 | | | $ | 67.72 | | | $ | 37.08 | |
| Effect of oil derivative settlements | $ | (21.46) | | | $ | (18.73) | | | $ | 14.40 | |
| | | | | |
| Gas: | | | | | |
| Average NYMEX monthly settle price (per MMBtu) | $ | 6.64 | | | $ | 3.84 | | | $ | 2.08 | |
| Realized price (per Mcf) | $ | 6.28 | | | $ | 4.85 | | | $ | 1.80 | |
| Effect of gas derivative settlements (per Mcf) | $ | (1.36) | | | $ | (1.41) | | | $ | 0.11 | |
| | | | | |
NGLs (per Bbl): | | | | | |
Average OPIS price (1) | $ | 43.48 | | | $ | 36.65 | | | $ | 17.96 | |
| Realized price | $ | 35.66 | | | $ | 33.67 | | | $ | 13.96 | |
| Effect of NGL derivative settlements | $ | (3.06) | | | $ | (13.68) | | | $ | 1.28 | |
____________________________________________
(1) Average OPIS prices per barrel of NGL, historical or strip, assumes a composite barrel product mix of 37% Ethane, 32% Propane, 6% Isobutane, 11% Normal Butane, and 14% Natural Gasoline for all periods presented. This product mix represents the industry standard composite barrel and does not necessarily represent our product mix for NGL production. Realized prices reflect our actual product mix.
Commodity prices increased in 2022 compared with both 2021 and 2020. However, given the uncertainty surrounding the ongoing conflict between Russia and Ukraine, the economic and trade sanctions that certain countries have imposed on Russia, production output from OPEC+, and the potential impacts of these issues on global commodity and financial markets, we expect benchmark prices for oil, gas, and NGLs to remain volatile for the foreseeable future. We cannot reasonably predict the timing or likelihood of any future commodity prices fluctuations that could be caused by further inflation, supply chain disruptions, a continued rise in interest rates, and industry-specific impacts. In addition to supply and demand fundamentals, as global commodities, the prices for oil, gas, and NGLs are affected by real or perceived geopolitical risks in various regions of the world as well as the relative strength of the United States dollar compared to other currencies. Our realized prices at local sales points may also be affected by infrastructure capacity in the areas of our operations and beyond.
The following table summarizes 12-month strip prices for NYMEX WTI oil, NYMEX Henry Hub gas, and OPIS NGLs as of February 9, 2023, and December 31, 2022:
| | | | | | | | | | | |
| As of February 9, 2023 | | As of December 31, 2022 |
| NYMEX WTI oil (per Bbl) | $ | 77.05 | | | $ | 79.47 | |
| NYMEX Henry Hub gas (per MMBtu) | $ | 3.19 | | | $ | 4.26 | |
| OPIS NGLs (per Bbl) | $ | 31.09 | | | $ | 29.85 | |
We use financial derivative instruments as part of our financial risk management program. We have a financial risk management policy governing our use of derivatives, and decisions regarding entering into commodity derivative contracts are overseen by a financial risk management committee consisting of certain senior executive officers and finance personnel. We make decisions about the amount of our expected production that we cover by derivatives based on the amount of debt on our balance sheet, the level of capital commitments and long-term obligations we have in place, and the terms and futures prices that are made available by our approved counterparties. With our current commodity derivative contracts, we believe we have partially reduced our exposure to volatility in commodity prices and basis differentials in the near term. Our use of costless collars for a portion of our derivatives allows us to participate in some of the upward movements in oil and gas prices while also setting a price floor below which we are insulated from further price decreases. Please refer to Note 10 – Derivative Financial Instruments in Part II, Item 8 of this report and to Commodity Price Risk in Overview of Liquidity and Capital Resources below for additional information regarding our oil, gas, and NGL derivatives.
Outlook
Our total 2023 capital program, which we expect to fund with cash flows from operations, is expected to be approximately $1.1 billion. We plan to focus our 2023 capital program on highly economic oil development projects in both our Midland Basin and South Texas assets. We expect to repurchase additional shares of our outstanding common stock through our Stock Repurchase Program during 2023, under which $442.8 million remained available for repurchases as of December 31, 2022.
Financial Results of Operations and Additional Comparative Data
The tables below provide information regarding selected production and financial information for the three months ended December 31, 2022, and the preceding three quarters:
| | | | | | | | | | | | | | | | | | | | | | | |
| For the Three Months Ended |
| December 31, | | September 30, | | June 30, | | March 31, |
| 2022 | | 2022 | | 2022 | | 2022 |
| (in millions) |
| Production (MMBOE) | 13.1 | | | 12.7 | | | 13.3 | | | 13.8 | |
Oil, gas, and NGL production revenue | $ | 669.3 | | | $ | 827.6 | | | $ | 990.4 | | | $ | 858.7 | |
| Oil, gas, and NGL production expense | $ | 150.7 | | | $ | 160.0 | | | $ | 165.6 | | | $ | 144.7 | |
| Depletion, depreciation, amortization, and asset retirement obligation liability accretion | $ | 143.6 | | | $ | 145.9 | | | $ | 154.8 | | | $ | 159.5 | |
| Exploration | $ | 10.8 | | | $ | 14.2 | | | $ | 20.9 | | | $ | 9.0 | |
| General and administrative | $ | 32.8 | | | $ | 28.4 | | | $ | 28.3 | | | $ | 25.0 | |
| Net income | $ | 258.5 | | | $ | 481.2 | | | $ | 323.5 | | | $ | 48.8 | |
____________________________________________
Note: Amounts may not calculate due to rounding.
Selected Performance Metrics
| | | | | | | | | | | | | | | | | | | | | | | |
| For the Three Months Ended |
| December 31, | | September 30, | | June 30, | | March 31, |
| 2022 | | 2022 | | 2022 | | 2022 |
| Average net daily equivalent production (MBOE per day) | 142.9 | | | 137.8 | | | 146.6 | | | 153.3 | |
| Lease operating expense (per BOE) | $ | 5.20 | | | $ | 5.64 | | | $ | 5.11 | | | $ | 4.25 | |
| Transportation costs (per BOE) | $ | 2.86 | | | $ | 2.87 | | | $ | 2.87 | | | $ | 2.74 | |
| Production taxes as a percent of oil, gas, and NGL production revenue | 4.8 | % | | 4.9 | % | | 5.1 | % | | 4.7 | % |
| Ad valorem tax expense (per BOE) | $ | 0.97 | | | $ | 0.93 | | | $ | 0.69 | | | $ | 0.58 | |
| Depletion, depreciation, amortization, and asset retirement obligation liability accretion (per BOE) | $ | 10.93 | | | $ | 11.50 | | | $ | 11.60 | | | $ | 11.56 | |
| General and administrative (per BOE) | $ | 2.50 | | | $ | 2.24 | | | $ | 2.12 | | | $ | 1.81 | |
____________________________________________
Note: Amounts may not calculate due to rounding.
Overview of Selected Production and Financial Information, Including Trends
| | | | | | | | | | | | | | | | | | | | | | | | | | | | | | | | | | | | | | | | | | | | | | | |
| For the Years Ended
December 31, | | Amount Change Between | | Percent Change Between |
| 2022 | | 2021 | | 2020 | | 2022/2021 | | 2021/2020 | | 2022/2021 | | 2021/2020 |
Net production volumes: (1) | | | | | | | | | | | | | |
| Oil (MMBbl) | 24.0 | | | 27.9 | | | 23.0 | | | (4.0) | | | 4.9 | | | (14) | % | | 21 | % |
| Gas (Bcf) | 125.9 | | | 108.4 | | | 103.9 | | | 17.6 | | | 4.5 | | | 16 | % | | 4 | % |
| NGLs (MMBbl) | 8.0 | | | 5.4 | | | 6.1 | | | 2.6 | | | (0.7) | | | 49 | % | | (12) | % |
| Equivalent (MMBOE) | 53.0 | | | 51.4 | | | 46.4 | | | 1.6 | | | 4.9 | | | 3 | % | | 11 | % |
Average net daily production: (1) | | | | | | | | | | | | | |
| Oil (MBbl per day) | 65.7 | | | 76.5 | | | 62.9 | | | (10.8) | | | 13.6 | | | (14) | % | | 22 | % |
| Gas (MMcf per day) | 345.0 | | | 296.9 | | | 283.9 | | | 48.1 | | | 13.0 | | | 16 | % | | 5 | % |
| NGLs (MBbl per day) | 21.9 | | | 14.7 | | | 16.7 | | | 7.2 | | | (2.0) | | | 49 | % | | (12) | % |
| Equivalent (MBOE per day) | 145.1 | | | 140.7 | | | 126.9 | | | 4.4 | | | 13.9 | | | 3 | % | | 11 | % |
Oil, gas, and NGL production revenue (in millions): (1) | | | | | | | | | | |
| Oil production revenue | $ | 2,270.1 | | | $ | 1,891.8 | | | $ | 853.6 | | | $ | 378.2 | | | $ | 1,038.3 | | | 20 | % | | 122 | % |
| Gas production revenue | 790.9 | | | 525.5 | | | 187.5 | | | 265.4 | | | 338.0 | | | 51 | % | | 180 | % |
| NGL production revenue | 285.0 | | | 180.6 | | | 85.2 | | | 104.3 | | | 95.4 | | | 58 | % | | 112 | % |
| Total oil, gas, and NGL production revenue | $ | 3,345.9 | | | $ | 2,597.9 | | | $ | 1,126.2 | | | $ | 748.0 | | | $ | 1,471.7 | | | 29 | % | | 131 | % |
Oil, gas, and NGL production expense (in millions): (1) | | | | | | | | | | |
| Lease operating expense | $ | 266.5 | | | $ | 225.5 | | | $ | 184.2 | | | $ | 41.0 | | | $ | 41.2 | | | 18 | % | | 22 | % |
| Transportation costs | 150.0 | | | 139.4 | | | 142.0 | | | 10.6 | | | (2.6) | | | 8 | % | | (2) | % |
| Production taxes | 162.6 | | | 121.1 | | | 46.1 | | | 41.5 | | | 75.0 | | | 34 | % | | 163 | % |
| Ad valorem tax expense | 41.7 | | | 19.4 | | | 18.9 | | | 22.3 | | | 0.5 | | | 115 | % | | 3 | % |
| Total oil, gas, and NGL production expense | $ | 620.9 | | | $ | 505.4 | | | $ | 391.2 | | | $ | 115.5 | | | $ | 114.2 | | | 23 | % | | 29 | % |
| Realized price: | | | | | | | | | | |
| Oil (per Bbl) | $ | 94.67 | | | $ | 67.72 | | | $ | 37.08 | | | $ | 26.95 | | | $ | 30.64 | | | 40 | % | | 83 | % |
| Gas (per Mcf) | $ | 6.28 | | | $ | 4.85 | | | $ | 1.80 | | | $ | 1.43 | | | $ | 3.05 | | | 29 | % | | 169 | % |
| NGLs (per Bbl) | $ | 35.66 | | | $ | 33.67 | | | $ | 13.96 | | | $ | 1.99 | | | $ | 19.71 | | | 6 | % | | 141 | % |
| Per BOE | $ | 63.18 | | | $ | 50.58 | | | $ | 24.26 | | | $ | 12.60 | | | $ | 26.32 | | | 25 | % | | 108 | % |
Per BOE data: (1) | | | | | | | | | | | | | |
| Oil, gas, and NGL production expense: | | | | | | | | | | | | |
| Lease operating expense | $ | 5.03 | | | $ | 4.39 | | | $ | 3.97 | | | $ | 0.64 | | | $ | 0.42 | | | 15 | % | | 11 | % |
| Transportation costs | 2.83 | | | 2.71 | | | 3.06 | | | 0.12 | | | (0.35) | | | 4 | % | | (11) | % |
| Production taxes | 3.07 | | | 2.36 | | | 0.99 | | | 0.71 | | | 1.37 | | | 30 | % | | 138 | % |
| Ad valorem tax expense | 0.79 | | | 0.38 | | | 0.41 | | | 0.41 | | | (0.03) | | | 108 | % | | (7) | % |
| Total oil, gas, and NGL production expense | $ | 11.72 | | | $ | 9.84 | | | $ | 8.43 | | | $ | 1.88 | | | $ | 1.41 | | | 19 | % | | 17 | % |
| Depletion, depreciation, amortization, and asset retirement obligation liability accretion | $ | 11.40 | | | $ | 15.08 | | | $ | 16.91 | | | $ | (3.68) | | | $ | (1.83) | | | (24) | % | | (11) | % |
| General and administrative | $ | 2.16 | | | $ | 2.18 | | | $ | 2.14 | | | $ | (0.02) | | | $ | 0.04 | | | (1) | % | | 2 | % |
Derivative settlement gain (loss) (2) | $ | (13.42) | | | $ | (14.58) | | | $ | 7.57 | | | $ | 1.16 | | | $ | (22.15) | | | 8 | % | | (293) | % |
Earnings per share information (in thousands, except per share data): (3) | | |
| Basic weighted-average common shares outstanding | 122,351 | | | 119,043 | | | 113,730 | | | 3,308 | | | 5,313 | | | 3 | % | | 5 | % |
| Diluted weighted-average common shares outstanding | 124,084 | | | 123,690 | | | 113,730 | | | 394 | | | 9,960 | | | — | % | | 9 | % |
| Basic net income (loss) per common share | $ | 9.09 | | | $ | 0.30 | | | $ | (6.72) | | | $ | 8.79 | | | $ | 7.02 | | | 2,930 | % | | 104 | % |
| Diluted net income (loss) per common share | $ | 8.96 | | | $ | 0.29 | | | $ | (6.72) | | | $ | 8.67 | | | $ | 7.01 | | | 2,990 | % | | 104 | % |
____________________________________________
(1) Amounts and percentage changes may not calculate due to rounding.
(2) Derivative settlements for the years ended December 31, 2022, 2021, and 2020, are included within the net derivative (gain) loss line item in the accompanying consolidated statements of operations (“accompanying statements of operations”).
(3) Please refer to Note 9 - Earnings Per Share in Part II, Item 8 of this report for additional discussion.
Average net daily equivalent production for the year ended December 31, 2022, increased three percent compared with 2021, as a result of a 37 percent increase in average net daily equivalent production from our South Texas assets outpacing a 14 percent decrease in average net daily equivalent production from our Midland Basin assets, as a result of increased capital allocation to our Austin Chalk assets. In 2023, we expect total production volumes to remain relatively flat compared with 2022, and we expect a slight decrease in oil as a percentage of total production. Please refer to Comparison of Financial Results and Trends Between 2022 and 2021 and Between 2021 and 2020 below for additional discussion.
We present certain information on a per BOE basis in order to evaluate our performance relative to our peers and to identify and measure trends we believe may require additional analysis and discussion.
Our realized price on a per BOE basis increased $12.60 for the year ended December 31, 2022, compared with 2021, primarily as a result of increased benchmark commodity prices. The loss on settlement of our commodity derivative contracts decreased $1.16 per BOE resulting from a lower percentage of production volumes covered by commodity derivative contracts that settled during the year ended December 31, 2022, compared with 2021.
LOE on a per BOE basis increased 15 percent for the year ended December 31, 2022, compared with 2021, primarily driven by increases in workover activity, and service provider costs that were impacted by inflation. For 2023, we expect LOE on a per BOE basis to increase, compared with 2022, primarily as a result of anticipated increases in service provider costs attributable to inflation, and increased workover activity, which we expect to be partially offset by increasing activity in the Austin Chalk, where operating costs are lower than in the Midland Basin. We anticipate volatility in LOE on a per BOE basis as a result of changes in total production, changes in our overall production mix, timing of workover projects, inflation, and industry activity, all of which impact total LOE.
Transportation costs on a per BOE basis increased four percent for the year ended December 31, 2022, compared with 2021. This increase was the result of a 37 percent increase in net daily equivalent production volumes from our South Texas assets which was partially offset by transportation contract cost reductions. In general, we expect total transportation costs to fluctuate relative to changes in gas and NGL production from our South Texas assets, where we incur a majority of our transportation costs. For 2023, we expect transportation costs on a per BOE basis to decrease compared with 2022 as a result of transportation cost reductions in the second half of 2023 resulting from the expiration of a long-term contract in South Texas.
Production tax expense on a per BOE basis for the year ended December 31, 2022, increased 30 percent compared with 2021, primarily driven by increases in realized prices. Our overall production tax rate was 4.9 percent and 4.7 percent for the years ended December 31, 2022, and 2021, respectively. We generally expect production tax expense to correlate with oil, gas, and NGL production revenue on an absolute and per BOE basis. Product mix, the location of production, and incentives to encourage oil and gas development can also impact the amount of production tax expense that we recognize.
Ad valorem tax expense on a per BOE basis increased 108 percent for the year ended December 31, 2022, compared with 2021, as a result of increases to the assessed values of our producing properties, driven by increases in commodity prices. We anticipate volatility in ad valorem tax expense on a per BOE and absolute basis as the valuation of our producing properties changes.
Depletion, depreciation, amortization, and asset retirement obligation liability accretion (“DD&A”) expense on a per BOE basis decreased 24 percent for the year ended December 31, 2022, compared with 2021, as a result of increased estimated proved reserves at the end of 2021 and during 2022, and increased activity in our Austin Chalk program, which has lower DD&A rates compared to our Midland Basin assets. We expect DD&A expense per BOE and on an absolute basis to increase slightly in 2023, compared with 2022, primarily as a result of inflation, partially offset by increased activity in our Austin Chalk program. Our DD&A rate fluctuates as a result of changes in our production mix, changes in our total estimated proved reserve volumes, changes in capital allocation, impairments, divestiture activity, and carrying cost funding and sharing arrangements with third parties.
General and administrative (“G&A”) expense on a per BOE basis remained relatively flat for the year ended December 31, 2022, compared with 2021. For 2023, we expect G&A expense per BOE and on an absolute basis to increase compared with 2022, primarily as a result of expected increases in compensation expense.
Please refer to Comparison of Financial Results and Trends Between 2022 and 2021 and Between 2021 and 2020 for additional discussion of operating expenses.
Comparison of Financial Results and Trends Between 2022 and 2021 and Between 2021 and 2020
Please refer to Comparison of Financial Results and Trends Between 2021 and 2020 and Between 2020 and 2019 in Management’s Discussion and Analysis of Financial Condition and Results of Operations in Part II, Item 7 of our 2021 Annual Report on Form 10-K, filed with the SEC on February 25, 2022, for a detailed discussion of certain comparisons of our financial results and trends for the year ended December 31, 2021, compared with the year ended December 31, 2020.
Average net daily equivalent production, production revenue, and production expense
The following table presents the changes in our average net daily equivalent production, production revenue, and production expense, by area, between the years ended December 31, 2022, and 2021:
| | | | | | | | | | | | | | | | | |
| Net Equivalent Production Increase (Decrease) | | Production Revenue Increase | | Production Expense Increase |
| (MBOE per day) | | (in millions) | | (in millions) |
| Midland Basin | (13.0) | | | $ | 222.0 | | | $ | 55.5 | |
| South Texas | 17.3 | | | 526.0 | | | 60.0 | |
| Total | 4.4 | | | $ | 748.0 | | | $ | 115.5 | |
____________________________________________
Note: Amounts may not calculate due to rounding.
Average net daily equivalent production volumes for the year ended December 31, 2022, increased three percent compared with 2021, comprised of a 37 percent increase from our South Texas assets, partially offset by a 14 percent decrease from our Midland Basin assets. Realized prices for oil, gas, and NGLs increased 40 percent, 29 percent, and six percent, respectively, for the year ended December 31, 2022, compared with 2021. As a result of increased production and pricing, production revenue for oil, gas, and NGLs increased 29 percent for the year ended December 31, 2022, compared with 2021. Total production expense for the year ended December 31, 2022, increased 23 percent, compared with 2021, primarily as a result of increased production taxes and LOE.
The following table presents the changes in our average net daily equivalent production, production revenue, and production expense, by area, between the years ended December 31, 2021, and 2020:
| | | | | | | | | | | | | | | | | |
| Net Equivalent Production Increase (Decrease) | | Production Revenue Increase | | Production Expense Increase |
| (MBOE per day) | | (in millions) | | (in millions) |
| Midland Basin | 14.9 | | | $ | 1,148.8 | | | $ | 95.0 | |
| South Texas | (1.0) | | | 322.9 | | | 19.2 | |
| Total | 13.9 | | | $ | 1,471.7 | | | $ | 114.2 | |
____________________________________________
Note: Amounts may not calculate due to rounding.
Average net daily equivalent production volumes for the year ended December 31, 2021, increased 11 percent compared with 2020, comprised of a 19 percent increase from our Midland Basin assets, partially offset by a two percent decrease from our South Texas assets. Realized prices for oil, gas, and NGLs increased 83 percent, 169 percent, and 141 percent, respectively, for the year ended December 31, 2021, compared with 2020. As a result of increased production and pricing, production revenue for oil, gas, and NGLs increased 131 percent for the year ended December 31, 2021, compared with 2020. Total production expense for the year ended December 31, 2021, increased 29 percent compared with 2020, primarily as a result of increased production taxes and LOE.
Please refer to Overview of Selected Production and Financial Information, Including Trends for additional discussion, including discussion of trends on a per BOE basis.
Depletion, depreciation, amortization, and asset retirement obligation liability accretion
| | | | | | | | | | | | | | | | | |
| For the Years Ended December 31, |
| 2022 | | 2021 | | 2020 |
| (in millions) |
| Depletion, depreciation, amortization, and asset retirement obligation liability accretion | $ | 603.8 | | | $ | 774.4 | | | $ | 785.0 | |
DD&A expense for the year ended December 31, 2022, decreased 22 percent compared with 2021, primarily as a result of increased estimated proved reserves at the end of 2021 and during 2022, and increased activity in our Austin Chalk program, which has lower DD&A rates compared to our Midland Basin assets. DD&A expense for the year ended December 31, 2021, remained flat compared with 2020. Please refer to Overview of Selected Production and Financial Information, Including Trends above for discussion of DD&A expense on a per BOE basis.
Exploration
| | | | | | | | | | | | | | | | | |
| For the Years Ended December 31, |
| 2022 | | 2021 | | 2020 |
| (in millions) |
| Geological, geophysical, and other expenses | $ | 24.7 | | | $ | 7.0 | | | $ | 11.6 | |
| Overhead | 30.2 | | | 32.3 | | | 29.4 | |
| Total | $ | 54.9 | | | $ | 39.3 | | | $ | 41.0 | |
__________________________________________
Note: Prior periods have been adjusted to conform to the current period presentation.
Exploration expense increased 40 percent for the year ended December 31, 2022, compared with 2021, primarily as a result of unsuccessful exploration activity related to one drilled and completed well that was subsequently abandoned outside of our core areas of operation. Exploration expense fluctuates based on actual geological and geophysical studies we perform within an exploratory area, exploratory dry hole expense incurred, and changes in the amount of allocated overhead.
Impairment
| | | | | | | | | | | | | | | | | |
| For the Years Ended December 31, |
| 2022 | | 2021 | | 2020 |
| (in millions) |
| Abandonment and impairment of unproved properties | $ | 7.5 | | | $ | 35.0 | | | $ | 59.3 | |
| Impairment of proved oil and gas properties and related support equipment | — | | | — | | | 956.7 | |
| Total | $ | 7.5 | | | $ | 35.0 | | | $ | 1,016.0 | |
Unproved property abandonments and impairments recorded during the years ended December 31, 2022, 2021, and 2020, related to actual and anticipated lease expirations, as well as actual and anticipated losses of acreage due to title defects, changes in development plans, and other inherent acreage risks. Impairment expense decreased 79 percent for the year ended December 31, 2022, compared with 2021, as a result of fewer actual and anticipated lease expirations and title defects.
During the year ended December 31, 2020, we recorded impairment expense related to our South Texas proved oil and gas properties and related support facilities as a result of the decrease in commodity price forecasts at the end of the first quarter of 2020, specifically decreases in oil and NGL prices.
We expect proved property impairments to occur more frequently in periods of declining or depressed commodity prices, and that the frequency of unproved property abandonments and impairments will fluctuate with the timing of lease expirations or title defects, and changing economics associated with decreases in commodity prices. Additionally, changes in drilling plans, unsuccessful exploration activities, and downward engineering revisions may result in proved and unproved property impairments.
Reserve estimates and related impairments of proved and unproved properties are difficult to predict in a volatile price environment. If commodity prices for the products we produce decline as a result of supply and demand fundamentals associated with geopolitical or macroeconomic events, we may experience additional proved and unproved property impairments in the future. Future impairments of proved and unproved properties are difficult to predict; however, based on our commodity price assumptions as of February 9, 2023, we do not expect any material oil and gas property impairments in the first quarter of 2023 resulting from commodity price impacts.
Please refer to Critical Accounting Estimates below and Note 8 – Fair Value Measurements in Part II, Item 8 of this report for additional discussion.
General and administrative
| | | | | | | | | | | | | | | | | |
| For the Years Ended December 31, |
| 2022 | | 2021 | | 2020 |
| (in millions) |
| General and administrative | $ | 114.6 | | | $ | 111.9 | | | $ | 99.2 | |
G&A expense remained flat for the year ended December 31, 2022, compared with 2021, and increased 13 percent for the year ended December 31, 2021, compared with 2020, primarily as a result of increased compensation expense. Please refer to Overview of Selected Production and Financial Information, Including Trends above for discussion of G&A expense.
Net derivative (gain) loss
| | | | | | | | | | | | | | | | | |
| For the Years Ended December 31, |
| 2022 | | 2021 | | 2020 |
| (in millions) |
| Net derivative (gain) loss | $ | 374.0 | | | $ | 901.7 | | | $ | (161.6) | |
Net derivative (gain) loss is a result of changes in derivative fair values associated with fluctuations in the forward price curves for the commodities underlying our outstanding derivative contracts and the monthly cash settlements of our derivative positions during the period. The net derivative losses for the years ended December 31, 2022, and 2021, resulted from increases in benchmark commodity prices during those years. The net derivative gain for the year ended December 31, 2020, resulted from decreases in benchmark commodity prices during 2020. Please refer to Note 10 – Derivative Financial Instruments in Part II, Item 8 of this report for additional discussion.
Other operating expense, net
| | | | | | | | | | | | | | | | | |
| For the Years Ended December 31, |
| 2022 | | 2021 | | 2020 |
| (in millions) |
| Other operating expense, net | $ | 3.5 | | | $ | 46.1 | | | $ | 24.8 | |
Other operating expense, net, recorded in 2021 and 2020, primarily consisted of legal settlements.
Interest expense
| | | | | | | | | | | | | | | | | |
| For the Years Ended December 31, |
| 2022 | | 2021 | | 2020 |
| (in millions) |
| Interest expense | $ | (120.3) | | | $ | (160.4) | | | $ | (163.9) | |
Interest expense decreased 25 percent for the year ended December 31, 2022, compared with 2021, as a result of the reduction in the aggregate principal amount of our Senior Notes through various transactions in 2022 and 2021. Total interest expense is impacted by, and can vary based on, the timing and amount of borrowings under our revolving credit facility. Please refer to Overview of Liquidity and Capital Resources below, and to Note 5 – Long-Term Debt in Part II, Item 8 of this report for additional discussion, including the definition of Senior Notes.
Net gain (loss) on extinguishment of debt
| | | | | | | | | | | | | | | | | |
| For the Years Ended December 31, |
| 2022 | | 2021 | | 2020 |
| (in millions) |
| Net gain (loss) on extinguishment of debt | $ | (67.6) | | | $ | (2.1) | | | $ | 280.1 | |
The redemption of our 2025 Senior Secured Notes during 2022 resulted in a net loss on extinguishment of debt of $67.2 million, which included $33.5 million of premium paid, $26.3 million of accelerated expense recognition of the unamortized debt discount, and $7.4 million of accelerated expense recognition of the unamortized deferred financing costs.
The Exchange Offers executed during 2020 resulted in a net gain on extinguishment of debt of $227.3 million, which was primarily comprised of the gain on the partial principal redemption of Old Notes and the debt discount associated with the issuance of the 2025 Senior Secured Notes. Additionally, during the year ended December 31, 2020, we repurchased certain of our 2022 Senior Notes and 2024 Senior Notes in open market transactions, resulting in a net gain on extinguishment of debt of $52.8 million.
Please refer to Note 5 – Long-Term Debt in Part II, Item 8 of this report for additional discussion, including the definitions of Exchange Offers, Old Notes, 2025 Senior Secured Notes, 2022 Senior Notes, and 2024 Senior Notes.
Income tax (expense) benefit
| | | | | | | | | | | | | | | | | |
| For the Years Ended December 31, |
| 2022 | | 2021 | | 2020 |
| (in millions, except tax rate) |
| Income tax (expense) benefit | $ | (283.8) | | | $ | (9.9) | | | $ | 192.1 | |
| Effective tax rate | 20.3 | % | | 21.5 | % | | 20.1 | % |
The decrease in the effective tax rate for the year ended December 31, 2022, compared with 2021, primarily resulted from the release of the valuation allowance recorded against the derivative deferred tax asset recognized in prior periods. As a result of the increase in income before income taxes for the year ended December 31, 2022, compared with 2021, the Company’s permanent items, including excess tax benefits from stock-based compensation and limits on expensing of certain individual’s compensation, had less of an impact on the effective tax rate for the year ended December 31, 2022, compared with 2021.
The increase in the effective tax rate for the year ended December 31, 2021, compared with 2020, was primarily due to the differing effects of permanent items on income before income taxes for the year ended December 31, 2021, compared to a loss before income taxes in 2020. During 2021, an additional valuation allowance recorded against tax effected net derivative liabilities partially offset by an excess tax benefit from stock-based compensation awards and other deferred tax adjustments, resulted in an increase in the tax rate year-over-year.
During 2022, we made federal estimated tax payments of $10.0 million. During the fourth quarter of 2022, we commissioned a multi-year research and development (“R&D") credit study which is expected to be completed in late 2023. We expect that this study will result in a favorable impact to our effective tax rate when the results are recorded.
Changes in federal income tax laws or enactment of proposed legislation to increase the corporate tax rate and eliminate or reduce certain oil and gas industry deductions could have a material impact on our effective tax rate and current tax expense. Effective for tax years beginning after December 31, 2022, the IRA creates a 15 percent corporate alternative minimum tax (“CAMT”) on average annual adjusted financial statement income exceeding $1.0 billion over any three-year period. The CAMT is currently not expected to have a material effect on our consolidated financial statements in future periods.
Please refer to Overview of Liquidity and Capital Resources and Critical Accounting Estimates below as well as Note 4 – Income Taxes in Part II, Item 8 of this report for further discussion.
Overview of Liquidity and Capital Resources
Based on the current commodity price environment, we believe we have sufficient liquidity and capital resources to execute our business plan while continuing to meet our current financial obligations. We continue to manage the duration and level of our drilling and completion service commitments in order to maintain flexibility with regard to our activity level and capital expenditures.
Sources of Cash
We expect our 2023 capital expenditure and return of capital programs to be funded by cash flows from operations. Although we expect cash flows from operations to be sufficient to fund our 2023 programs, we may also use borrowings under our revolving credit facility or raise funds through new debt or equity offerings or from other sources of financing. If we raise additional funds through the issuance of equity or convertible debt securities, the percentage ownership of our current stockholders could be diluted, and these newly issued securities may have rights, preferences, or privileges senior to those of existing stockholders and bondholders. Additionally, we may enter into carrying cost and sharing arrangements with third parties for certain exploration or development programs. All of our sources of liquidity can be affected by the general conditions of the broader economy, force majeure events,
fluctuations in commodity prices, operating costs, interest rate changes, tax law changes, and volumes produced, all of which affect us and our industry.
Our credit ratings impact the availability of and cost for us to borrow additional funds. Three major credit rating agencies upgraded our credit ratings during 2022, reflecting our top-tier assets and operational performance, our priority of improving our leverage metrics, our ability to consistently generate cash flows and our decision to use a portion of the proceeds to reduce total debt, our strong liquidity profile, and our use of financial derivative instruments as part of our financial risk management program.
We have no control over the market prices for oil, gas, and NGLs, although we may be able to influence the amount of our realized revenues from our oil, gas, and NGL sales through the use of commodity derivative contracts as part of our commodity price risk management program. Commodity derivative contracts may limit the prices we receive for our oil, gas, and NGL sales if oil, gas, or NGL prices rise substantially over the price established by the commodity derivative contract. Please refer to Note 10 – Derivative Financial Instruments in Part II, Item 8 of this report for additional information about our commodity derivative contracts currently in place and the timing of settlement of those contracts.
Credit Agreement
Our Credit Agreement provides for a senior secured revolving credit facility with a maximum loan amount of $3.0 billion, a borrowing base of $2.5 billion, and aggregate lender commitments totaling $1.25 billion. The borrowing base is subject to regular, semi-annual redetermination, and considers the value of both our proved oil and gas properties reflected in our most recent reserve report and commodity derivative contracts, each as determined by our lender group. The next scheduled borrowing base redetermination date is April 1, 2023. No individual bank participating in our Credit Agreement represents more than 10 percent of the lender commitments under the Credit Agreement. We must comply with certain financial and non-financial covenants under the terms of the Credit Agreement, including covenants limiting dividend payments and requiring that we maintain certain financial ratios, as set forth in the Credit Agreement. We were in compliance with all financial and non-financial covenants as of December 31, 2022, and through the filing of this report. Please refer to Note 5 – Long-Term Debt in Part II, Item 8 of this report for additional discussion, as well as the presentation of the outstanding balance, total amount of letters of credit, and available borrowing capacity under the Credit Agreement as of February 9, 2023, December 31, 2022, and December 31, 2021.
We had no revolving credit facility borrowings during the year ended December 31, 2022. Our daily weighted-average revolving credit facility debt balance was $106.0 million for the year ended December 31, 2021. Cash flows provided by our operating activities, proceeds received from divestitures of properties, capital markets activities including open market debt repurchases, debt redemptions, repayment of scheduled debt maturities, our capital expenditures, including acquisitions, and other financing activities, all impact the amount we borrow under our revolving credit facility.
Weighted-Average Interest and Weighted-Average Borrowing Rates
Our weighted-average interest rate includes paid and accrued interest, fees on the unused portion of the aggregate commitment amount under the Credit Agreement, letter of credit fees, the non-cash amortization of deferred financing costs, and for the periods during which they were outstanding, the non-cash amortization of the discounts related to the 2021 Senior Secured Convertible Notes and 2025 Senior Secured Notes, each as defined in Note 5 – Long-Term Debt in Part II, Item 8 of this report. Our weighted-average borrowing rate includes paid and accrued interest only.
The following table presents our weighted-average interest rates and our weighted-average borrowing rates for the years ended December 31, 2022, 2021, and 2020:
| | | | | | | | | | | | | | | | | |
| For the Years Ended December 31, |
| 2022 | | 2021 | | 2020 |
| Weighted-average interest rate | 7.6 | % | | 7.7 | % | | 7.0 | % |
| Weighted-average borrowing rate | 6.8 | % | | 6.8 | % | | 6.1 | % |
Our weighted-average interest rate remained flat for the year ended December 31, 2022, compared with 2021, as an increase in deferred financing costs and higher commitment fees resulting from the increase in aggregate lender commitments under the Credit Agreement were offset by decreases related to the redemption of the 2025 Senior Secured Notes. Our weighted-average borrowing rate remained flat for the year ended December 31, 2022, compared with 2021, as a result of the timing of redemptions of our Senior Notes during 2022 and 2021. Our weighted-average interest and weighted-average borrowing rates increased for the year ended December 31, 2021, compared with 2020, primarily as a result of the higher interest rate on our 2025 Senior Secured Notes issued during 2020.
Our weighted-average interest and weighted-average borrowing rates are impacted by the occurrence and timing of long-term debt issuances and redemptions and the average outstanding balance on our revolving credit facility. Additionally, our weighted-average interest rate is impacted by the fees paid on the unused portion of our aggregate lender commitments. The rates disclosed in
the above table do not reflect certain amounts associated with the repurchase or redemption of Senior Notes, such as the accelerated expense recognition of the unamortized deferred financing costs and unamortized discounts, as these amounts are netted against the associated gain or loss on extinguishment of debt. The 2021 Senior Secured Convertible Notes were retired upon maturity on July 1, 2021, the 2024 Senior Notes were redeemed on February 14, 2022, and the 2025 Senior Secured Notes were redeemed on June 17, 2022. After these dates, the weighted-average interest rate was no longer impacted by the non-cash amortization of deferred financing costs for the redeemed or retired notes, or for 2021 Senior Secured Convertible Notes and the 2025 Senior Secured Notes, the non-cash amortization of the discounts. Please refer to Note 5 – Long-Term Debt in Part II, Item 8 of this report for additional discussion and definitions.
Uses of Cash
We use cash for the development, exploration, and acquisition of oil and gas properties; for the payment of operating and general and administrative costs, income taxes, dividends, and debt obligations, including interest and early repayments or redemptions; and for repurchases of shares of our common stock under the Stock Repurchase Program. Expenditures for the development, exploration, and acquisition of oil and gas properties are the primary use of our capital resources. During 2022, we spent approximately $879.9 million on capital expenditures. This amount differs from the costs incurred amount of $961.7 million for the year ended December 31, 2022, as costs incurred is an accrual-based amount that also includes asset retirement obligations, geological and geophysical expenses, acquisitions of oil and gas properties, and exploration overhead amounts. Please refer to Costs Incurred in Supplemental Oil and Gas Information (unaudited) in Part II, Item 8 of this report for additional discussion.
The amount and allocation of our future capital expenditures will depend upon a number of factors, including our cash flows from operating, investing, and financing activities, our ability to execute our development program, inflation, and the number and size of acquisitions that we complete. In addition, the impact of oil, gas, and NGL prices on investment opportunities, the availability of capital, tax law changes, and the timing and results of our exploration and development activities may lead to changes in funding requirements for future development. We periodically review our capital expenditure budget to assess if changes are necessary based on current and projected cash flows, acquisition and divestiture activities, debt requirements, and other factors.
Changes to the Internal Revenue Code (“IRC“), such as the CAMT enacted pursuant to the IRA, effective for tax years beginning after December 31, 2022, could increase the corporate income tax rate and could eliminate or reduce current tax deductions for intangible drilling costs, depreciation of equipment costs, and other deductions which currently reduce our taxable income. While the CAMT is not currently applicable to us, it and other future legislation could reduce our net cash provided by operating activities over time, and could therefore result in a reduction of funding available for the items discussed above.
We may from time to time repurchase shares of our common stock, or repurchase or redeem all or portions of our outstanding debt securities, for cash, through exchanges for other securities, or a combination of both. Such repurchases or redemptions may be made in open market transactions, privately negotiated transactions, tender offers, pursuant to contractual provisions, or otherwise. Any such repurchases or redemptions will depend on prevailing market conditions, our liquidity requirements, contractual restrictions or covenants, compliance with securities laws, and other factors. The amounts involved in any such transaction may be material.
On September 7, 2022, we announced that our Board of Directors approved the Stock Repurchase Program authorizing us to repurchase up to $500.0 million in aggregate value of our common stock through December 31, 2024. We intend to fund repurchases with net cash provided by operating activities. Stock repurchases may also be funded with borrowings under the Credit Agreement. The timing, as well as the number and value of our shares repurchased under the Stock Repurchase Program, will be determined by certain authorized officers of the Company at their discretion and will depend on a variety of factors, including the market price of our common stock, general market and economic conditions and applicable legal requirements. During the year ended December 31, 2022, we repurchased and subsequently retired 1,365,255 shares of our common stock at a cost of $57.2 million, and as of December 31, 2022, $442.8 million remained available under the Stock Repurchase Program for repurchases of our common stock. Effective January 1, 2023, shares of common stock repurchased, net of shares of common stock issued, will be subject to a one percent excise tax imposed by the IRA. The Stock Repurchase Program terminates and supersedes the August 1998 authorization to repurchase common stock, under which 3,072,184 shares remained available for repurchase prior to termination. Please refer to Note 3 - Equity in Part II, Item 8 of this report for additional discussion.
During 2022, we redeemed all of the aggregate principal amount outstanding of our 2024 Senior Notes and our 2025 Senior Secured Notes. During 2021, we issued our 2028 Senior Notes and with the proceeds, repurchased certain of our then outstanding 2022 Senior Notes and 2024 Senior Notes through the Tender Offer. Subsequently, we redeemed the remaining 2022 Senior Notes then outstanding through the 2022 Senior Notes Redemption. The 2021 Senior Secured Convertible Notes matured on July 1, 2021, and on that day, we used borrowings under our revolving credit facility to retire, at par, the outstanding principal amount. These transactions were completed as part of our strategy to reduce absolute debt and improve our leverage metrics. Please refer to Note 5 – Long-Term Debt in Part II, Item 8 of this report for additional discussion and definitions.
During the years ended December 31, 2022, 2021, and 2020, we paid $19.6 million, $2.4 million, and $2.3 million, respectively, in dividends to our stockholders. During 2022, our Board of Directors approved an increase to our fixed dividend to $0.60 per share annually, to be paid in quarterly increments of $0.15 per share. Dividends paid reflects $0.16 per share paid during the year ended December 31, 2022, and $0.02 per share paid during each of the years ended December 31, 2021, and 2020. Our current
intention is to continue to make dividend payments for the foreseeable future, subject to our future earnings, our financial condition, covenants under our Credit Agreement and indentures governing each series of our outstanding Senior Notes, other covenants, and other factors that could arise. The payment and amount of future dividends remains at the discretion of our Board of Directors.
Analysis of Cash Flow Changes Between 2022 and 2021 and Between 2021 and 2020
The following tables present changes in cash flows between the years ended December 31, 2022, 2021, and 2020, for our operating, investing, and financing activities. The analysis following each table should be read in conjunction with our accompanying consolidated statements of cash flows (“accompanying statements of cash flows”) in Part II, Item 8 of this report.
Operating Activities
| | | | | | | | | | | | | | | | | | | | | | | | | | | | | | | | | |
| For the Years Ended December 31, | | Amount Change Between | | |
| 2022 | | 2021 | | 2020 | | 2022/2021 | | 2021/2020 | | | | |
| (in millions) | | | | |
| Net cash provided by operating activities | $ | 1,686.4 | | | $ | 1,159.8 | | | $ | 790.9 | | | $ | 526.6 | | | $ | 368.9 | | | | | |
Net cash provided by operating activities increased for the year ended December 31, 2022, compared with 2021, primarily as a result of an $833.2 million increase in cash received from oil, gas, and NGL production revenues, net of transportation costs and production taxes, partially offset by an increase in cash paid for LOE and G&A expense of $70.7 million and an increase of $69.2 million in cash paid on settled derivative trades.
Net cash provided by operating activities increased for the year ended December 31, 2021, compared with 2020, primarily as a result of a $1.3 billion increase in cash received from oil, gas, and NGL production revenues, net of transportation costs and production taxes, partially offset by an increase of $1.0 billion in cash paid on settled derivative trades.
Net cash provided by operating activities is affected by working capital changes and the timing of cash receipts and disbursements.
Investing Activities
| | | | | | | | | | | | | | | | | | | | | | | | | | | | | | | | | |
| For the Years Ended December 31, | | Amount Change Between | | |
| 2022 | | 2021 | | 2020 | | 2022/2021 | | 2021/2020 | | | | |
| (in millions) | | | | |
| Net cash used in investing activities | $ | (880.3) | | | $ | (667.2) | | | $ | (555.6) | | | $ | (213.1) | | | $ | (111.6) | | | | | |
Net cash used in investing activities increased for the year ended December 31, 2022, compared with 2021, primarily as a result of a $205.1 million increase in capital expenditures. Net cash used in investing activities during the year ended December 31, 2022, was funded by net cash provided by operating activities.
Net cash used in investing activities increased for the year ended December 31, 2021, compared with 2020, primarily as a result of a $127.1 million increase in capital expenditures. Net cash used in investing activities during the year ended December 31, 2021, was funded by net cash provided by operating activities.
Financing Activities
| | | | | | | | | | | | | | | | | | | | | | | | | | | | | | | | | |
| For the Years Ended December 31, | | Amount Change Between | | |
| 2022 | | 2021 | | 2020 | | 2022/2021 | | 2021/2020 | | | | |
| (in millions) | | | | |
| Net cash used in financing activities | $ | (693.9) | | | $ | (159.8) | | | $ | (235.4) | | | $ | (534.1) | | | $ | 75.6 | | | | | |
Net cash used in financing activities for the year ended December 31, 2022, related to $480.2 million of cash paid, including premium, to redeem our 2025 Senior Secured Notes, and $104.8 million of cash paid to redeem our 2024 Senior Notes. These redemptions were made using cash on hand. Additionally, we paid $57.2 million to repurchase and subsequently retire 1,365,255 shares of our common stock under the Stock Repurchase Program, $25.1 million for the net share settlement of employee and director stock awards, and $19.6 million in dividends to our stockholders. Please refer to Note 3 - Equity in Part II, Item 8 of this report for additional discussion of our Stock Repurchase Program.
During the year ended December 31, 2021, we paid $385.3 million, including net premiums, to fund the Tender Offer and the 2022 Senior Notes Redemption, and we received net cash proceeds of $392.8 million from the issuance of our 2028 Senior Notes. Additionally, we paid $65.5 million to retire our 2021 Senior Secured Convertible Notes and had net repayments under our revolving credit facility of $93.0 million.
During the year ended December 31, 2020, we paid $136.5 million to repurchase certain of our 2022 Senior Notes and 2024 Senior Notes in open market transactions, we paid $53.5 million to certain holders of the 2021 Senior Secured Convertible Notes in connection with the Private Exchange, and we had net repayments under our revolving credit facility of $29.5 million.
Please refer to Note 5 – Long-Term Debt in Part II, Item 8 of this report for additional discussion and definitions.
Interest Rate Risk
We are exposed to risk due to the floating interest rate associated with any outstanding balance on our revolving credit facility. Our Credit Agreement allows us to fix the interest rate for all or a portion of the principal balance of our revolving credit facility for a period up to six months. To the extent that the interest rate is fixed, interest rate changes will affect the revolving credit facility’s fair value but will not impact results of operations or cash flows. Conversely, for the portion of the revolving credit facility that has a floating interest rate, interest rate changes will not affect the fair value but will impact future results of operations and cash flows. Changes in interest rates do not impact the amount of interest we pay on our fixed-rate Senior Notes, but can impact their fair values. As of December 31, 2022, our outstanding principal amount of fixed-rate debt totaled $1.6 billion and we had no floating-rate debt outstanding. As we had no borrowings under our revolving credit facility during 2022, we had no exposure to variable interest rates during the year ended December 31, 2022. Please refer to Note 8 – Fair Value Measurements in Part II, Item 8 of this report for additional discussion on the fair values of our Senior Notes.
The Federal Reserve increased short-term interest rates throughout 2022 and into early 2023. These increases, and any future increases, could impact the cost and our ability to borrow funds.
Commodity Price Risk
The prices we receive for our oil, gas, and NGL production directly impact our revenue, profitability, access to capital, ability to execute our Stock Repurchase Program and pay dividends, and future rate of growth. Oil, gas, and NGL prices are subject to unpredictable fluctuations resulting from a variety of factors that are typically beyond our control, including changes in supply and demand associated with the broader macroeconomic environment, constraints on gathering systems, processing facilities, pipelines, and other transportation systems, and weather-related events. The markets for oil, gas, and NGLs have been volatile, especially over the last decade, and remain subject to high levels of uncertainty and volatility related to the ongoing conflict between Russia and Ukraine, the economic and trade sanctions that certain countries have imposed on Russia, production output from OPEC+, and the associated potential impacts of these issues on global commodity and financial markets. These issues have contributed to inflation, supply chain disruptions, a rise in interest rates, and could have further industry-specific impacts, which may require us to adjust our business plan. The realized prices we receive for our production also depend on numerous factors that are typically beyond our control. Based on our 2022 production, a 10 percent decrease in our average realized prices for oil, gas, and NGLs, would have reduced our oil, gas, and NGL production revenues by approximately $227.0 million, $79.1 million, and $28.5 million, respectively. If commodity prices had been 10 percent lower, our net derivative settlements for the year ended December 31, 2022, would have offset the declines in oil, gas, and NGL production revenue by approximately $157.9 million.
We enter into commodity derivative contracts in order to reduce the risk of fluctuations in commodity prices. The fair value of our commodity derivative contracts is largely determined by estimates of the forward curves of the relevant price indices. As of December 31, 2022, a 10 percent increase or decrease in the forward curves associated with our oil and gas commodity derivative instruments would have changed our net derivative positions for these products by approximately $61.1 million and $1.9 million, respectively.
Off-Balance Sheet Arrangements
We have not participated in transactions that generate relationships with unconsolidated entities or financial partnerships, such as entities often referred to as structured finance or special purpose entities (“SPE” or “SPEs”), which would have been established for the purpose of facilitating off-balance sheet arrangements or other contractually narrow or limited purposes.
We evaluate our transactions to determine if any variable interest entities exist. If we determine that we are the primary beneficiary of a variable interest entity, that entity is consolidated into our consolidated financial statements. We have not been involved in any unconsolidated SPE transactions during 2022 or 2021, or through the filing of this report.
Critical Accounting Estimates
Our discussion of financial condition and results of operations is based upon the information reported in our consolidated financial statements. The preparation of these consolidated financial statements in conformity with GAAP requires us to make assumptions and estimates that affect the reported amounts of assets, liabilities, revenues, and expenses, as well as the disclosure of contingent assets and liabilities as of the date of our consolidated financial statements. We base our assumptions and estimates on historical experience and various other sources that we believe to be reasonable under the circumstances. Actual results may differ from the estimates we calculate as a result of changes in circumstances, global economics and politics, and general business conditions. A summary of our significant accounting policies is detailed in Note 1 – Summary of Significant Accounting Policies in Part II, Item 8 of this report. We have outlined below, those policies identified as being critical to the understanding of our business and results of operations and that require the application of significant management judgment.
Successful Efforts Method of Accounting. GAAP provides two alternative methods for the oil and gas industry to use in accounting for oil and gas producing activities. These two methods are generally known in our industry as the full cost method and the successful efforts method, and both methods are widely used. The methods are different enough that in many circumstances the same set of facts will provide materially different financial statement results within a given year. We have chosen the successful efforts method of accounting for our oil and gas producing activities. A more detailed description is included in Note 1 – Summary of Significant Accounting Policies of Part II, Item 8 of this report.
Oil and Gas Reserve Quantities. Our estimated proved reserve quantities and future net cash flows are critical to understanding the value of our business. They are used in comparative financial ratios and are the basis for significant accounting estimates in our consolidated financial statements, including the calculations of DD&A expense, impairment of proved and unproved oil and gas properties, and asset retirement obligations. Please refer to Oil and Gas Producing Activities in Note 1 – Summary of Significant Accounting Policies of Part II, Item 8 of this report for additional discussion on our accounting policies impacted by estimated reserve quantities.
Future cash inflows and future production and development costs are determined by applying prices and costs, including transportation, quality differentials, and basis differentials, applicable to each period to the estimated quantities of proved reserves remaining to be produced as of the end of that period. Expected cash flows are discounted to present value using an appropriate discount rate. For example, the standardized measure of discounted future net cash flows calculation requires that a 10 percent discount rate be applied. Although reserve estimates are inherently imprecise, and estimates of new discoveries and undeveloped locations are more imprecise than those of established producing oil and gas properties, we make a considerable effort in estimating our reserves. We engage Ryder Scott, an independent reservoir evaluation consulting firm, to audit a minimum of 80 percent of our total calculated proved reserve PV-10. We expect proved reserve estimates will change as additional information becomes available and as commodity prices and operating and capital costs change. We evaluate and estimate our proved reserves each year end. It should not be assumed that the standardized measure of discounted future net cash flows (GAAP) or PV-10 (non-GAAP) as of December 31, 2022, is the current market value of our estimated proved reserves. In accordance with SEC requirements, we based these measures on the unweighted arithmetic average of the first-day-of-the-month price of each month within the trailing 12-month period ended December 31, 2022. Actual future prices and costs may be materially higher or lower than the prices and costs utilized in the estimates. Please refer to Risk Factors in Part I, Item 1A of this report for additional discussion.
If the estimates of proved reserves decline, the rate at which we record DD&A expense will increase, which would reduce future net income. Changes in DD&A rate calculations caused by changes in reserve quantities are made prospectively. In addition, a decline in reserve estimates may impact the outcome of our assessment of proved and unproved properties for impairment. Impairments are recorded in the period in which they are identified.
The following table presents information about proved reserve changes from period to period due to items we do not control, such as price, and from changes due to production history and well performance. These changes do not require a capital expenditure on our part, but may have resulted from capital expenditures we incurred to develop other estimated proved reserves.
| | | | | | | | | | | | | | | | | |
| For the Years Ended December 31, |
| 2022 | | 2021 | | 2020 |
| MMBOE Change |
| Revisions resulting from performance | (11.1) | | | 3.4 | | | 3.6 | |
| Removal of proved undeveloped reserves no longer in our five-year development plan | (19.9) | | | (40.6) | | | (65.0) | |
| Revisions resulting from price changes | 9.5 | | | 37.2 | | | (32.6) | |
| Total | (21.5) | | | — | | | (94.0) | |
____________________________________________
Note: Amounts may not calculate due to rounding.
As previously noted, commodity prices are volatile and estimates of reserves are inherently imprecise. Consequently, we expect to continue experiencing these types of changes.
We cannot reasonably predict future commodity prices, although we believe that together, the below analyses provide reasonable information regarding the impact of changes in pricing and trends on total estimated proved reserves. The following table reflects the estimated MMBOE change and percentage change to our total reported estimated proved reserve volumes from the described hypothetical changes:
| | | | | | | | | | | |
| For the year ended December 31, 2022 |
| MMBOE Change | | Percentage Change |
10 percent decrease in SEC pricing (1) | (3.7) | | | (1) | % |
Average NYMEX strip pricing as of fiscal year end (2) | (14.3) | | | (3) | % |
10 percent decrease in proved undeveloped reserves (3) | (22.0) | | | (4) | % |
____________________________________________
(1) The change solely reflects the impact of a 10 percent decrease in SEC pricing to the total reported estimated proved reserve volumes as of December 31, 2022, and does not include additional impacts to our estimated proved reserves that may result from our internal intent to drill hurdles or changes in future service or equipment costs.
(2) The change solely reflects the impact of replacing SEC pricing with the five-year average NYMEX strip pricing as of December 31, 2022, and does not include additional impacts to our estimated proved reserves that may result from our internal intent to drill hurdles or changes in future service or equipment costs. As of December 31, 2022, SEC pricing was $93.67 per Bbl for oil, $6.36 per MMBtu for gas, and $42.52 per Bbl for NGLs, and five-year average NYMEX strip pricing was $71.02 per Bbl for oil, $4.38 per MMBtu for gas, and $28.05 per Bbl for NGLs.
(3) The change solely reflects a 10 percent decrease in proved undeveloped reserves as of December 31, 2022, and does not include any additional impacts to our estimated proved reserves.
Additional reserve information can be found in Reserves in Part I, Items 1 and 2 of this report, and in Supplemental Oil and Gas Information (unaudited) in Part II, Item 8 of this report.
Impairment of Oil and Gas Properties. Proved oil and gas properties are evaluated for impairment on a pool-by-pool basis and reduced to fair value when events or changes in circumstances indicate that their carrying amount may not be recoverable. We estimate the expected future cash flows of our proved oil and gas properties and compare these undiscounted cash flows to the carrying amount to determine if the carrying amount is recoverable. If the carrying amount exceeds the estimated undiscounted future cash flows, we will write down the carrying amount of the proved oil and gas properties to fair value (or discounted future cash flows). Management estimates future cash flows from all proved reserves and risk adjusted probable and possible reserves using various factors, which are subject to our judgment and expertise, and include, but are not limited to, commodity price forecasts, estimated future operating and capital costs, development plans, and discount rates to incorporate the risk and current market conditions associated with realizing the expected cash flows.
Unproved oil and gas properties are evaluated for impairment and reduced to fair value when there is an indication that the carrying costs may not be recoverable. Lease acquisition costs that are not individually significant are aggregated by asset group and the portion of such costs estimated to be nonproductive prior to lease expiration are amortized over the appropriate period. The estimate of what could be nonproductive is based on historical trends or other information, including current drilling plans and our intent to renew leases. We estimate the fair value of unproved properties using a market approach, which takes into account the following significant assumptions: remaining lease terms, future development plans, risk weighted potential resource recovery, estimated reserve values, and estimated acreage value based on price(s) received for similar, recent acreage transactions by us or other market participants.
We cannot predict when or if future impairment charges will be recorded because of the uncertainty in the factors discussed above. Despite any amount of future impairment being difficult to predict, based on our commodity price assumptions as of February 9, 2023, we do not expect any material oil and gas property impairments in the first quarter of 2023 resulting from commodity price impacts.
Please refer to Note 1 – Summary of Significant Accounting Policies and Note 8 – Fair Value Measurements in Part II, Item 8 of this report for discussion of impairments of oil and gas properties recorded for the years ended December 31, 2022, 2021, and 2020.
Revenue Recognition. We predominately derive our revenue from the sale of produced oil, gas, and NGLs. Our revenue recognition policy is a critical accounting estimate because revenue is a key component of our results of operations and our forward-looking statements contained in our analysis of liquidity and capital resources. A 10 percent change in our revenue accrual at year-end 2022 would have impacted total operating revenues by approximately $18.4 million for the year ended December 31, 2022. Please refer to Note 1 – Summary of Significant Accounting Policies and Note 2 - Revenue from Contracts with Customers in Part II, Item 8 of this report for additional discussion.
Derivative Financial Instruments. We periodically enter into commodity derivative contracts to mitigate a portion of our exposure to oil, gas, and NGL price volatility and location differentials. We recognize all gains and losses from changes in commodity derivative fair values immediately in earnings rather than deferring any such amounts in accumulated other comprehensive income (loss). The estimated fair value of our derivative instruments requires substantial judgment. These values are based upon, among other things, option pricing models, futures prices, volatility, time to maturity, and credit risk. The values we report in our consolidated financial statements change as these estimates are revised to reflect actual results, changes in market conditions or other factors, many of which are beyond our control. Please refer to Note 1 – Summary of Significant Accounting Policies and Note 10 – Derivative Financial Instruments in Part II, Item 8 of this report for additional discussion.
Income Taxes. We account for deferred income taxes, whereby deferred tax assets and liabilities are recognized based on the tax effects of temporary differences between the carrying amounts on the consolidated financial statements and the tax basis of assets and liabilities, as measured using currently enacted tax rates. These differences will result in taxable income or deductions in future years when the reported amounts of the assets or liabilities are recovered or settled, respectively. Considerable judgment is required in predicting when these events may occur and whether recovery of an asset is more likely than not. We record deferred tax assets and associated valuation allowances, when appropriate, to reflect amounts more likely than not to be realized based upon Company analysis. Additionally, our federal and state income tax returns are generally not filed before the consolidated financial statements are prepared. Therefore, we estimate the tax basis of our assets and liabilities at the end of each period, as well as the effects of tax rate changes, tax credits, and net operating and capital loss carryforwards and carrybacks. Adjustments related to differences between the estimates we use and actual amounts we report are recorded in the periods in which we file our income tax returns. These adjustments and changes in our estimates of asset recovery and liability settlement as well as significant enacted tax rate changes could have an impact on our results of operations. A one percent change in our effective tax rate would have changed our calculated income tax expense by approximately $14.0 million for the year ended December 31, 2022. Please refer to Note 1 – Summary of Significant Accounting Policies and Note 4 – Income Taxes in Part II, Item 8 of this report for additional discussion.
Accounting Matters
Please refer to Recently Issued Accounting Standards in Note 1 – Summary of Significant Accounting Policies in Part II, Item 8 of this report for information on new authoritative accounting guidance.
Environmental
We believe we are in substantial compliance with environmental laws and regulations and do not currently anticipate that material future expenditures will be required under the existing regulatory framework. However, environmental laws and regulations are subject to frequent changes, and we are unable to predict the impact that compliance with future laws or regulations, such as those currently being considered as discussed below, may have on future capital expenditures, liquidity, and results of operations.
Hydraulic Fracturing. Hydraulic fracturing is an important and common practice that is used to stimulate production of hydrocarbons from tight formations. For additional information about hydraulic fracturing and related environmental matters, please refer to Risk Factors – Risks Related to Oil and Gas Operations and the Industry – Federal and state legislative and regulatory initiatives relating to hydraulic fracturing could result in increased costs and additional operating restrictions or delays.
Climate Change and Air Quality. In June 2013, President Obama announced a Climate Action Plan designed to further reduce GHG emissions and prepare the nation for the physical effects that may occur as a result of climate change. The Climate Action Plan targeted methane reductions from the oil and gas sector as part of a comprehensive interagency methane strategy. As part of the Climate Action Plan, on May 12, 2016, the EPA issued final regulations applicable to new, modified, or reconstructed sources that amended and expanded 2012 regulations for the oil and gas sector by, among other things, setting emission limits for volatile organic compounds (“VOCs” or “VOC”) and methane, a GHG, and added requirements for previously unregulated sources. The 2016 NSPS requires reduction of methane and VOCs from certain activities in oil and gas production, processing, transmission and storage and applies to facilities constructed, modified, or reconstructed after September 18, 2015. The regulation requires, among other things, GHG and VOC emission limits for certain equipment, such as centrifugal compressors and reciprocating compressors; semi-annual leak detection and repair for well sites and quarterly for boosting and garnering compressor stations and gas transmission compressor stations; control requirements and emission limits for pneumatic pumps; and additional requirements for control of GHGs and VOCs from well completions. On September 14, and 15, 2020, the EPA finalized amendments to the 2012 and 2016 NSPS that removed transmission and storage infrastructure from regulation of methane emissions and other VOCs, as well as removed methane control requirements. The portion of the 2020 amendments that removed the transmission and storage infrastructure from the regulations was disapproved by the Congressional Review Act in 2021. In November 2021, the EPA proposed to expand the requirements of the 2012 and 2016 NSPS and also include requirements for states to develop performance standards to control methane emissions from existing sources. In December 2022, the EPA issued a supplemental proposal to update, strengthen, and expand the 2021 proposed rules. The EPA is expected to finalize the rule in 2023.
States are also required to comply with the NAAQS. The oil and gas sector is often subjected to additional controls when areas within states are not attaining the ozone NAAQS as the VOCs emitted by the oil and gas sector are a precursor to ozone formation. The ozone NAAQS was set at 70 parts per billion (“ppb”) in 2015. The EPA maintained the standard in 2020, but in 2021 the EPA communicated that it is reconsidering the 2020 decision with the intention of completing the reconsideration by the end of 2023. If
the ozone NAAQS is lowered, it may result in additional actions by states requiring further emission controls and associated costs. Oil and gas facilities operating in areas that are determined to be out of compliance with the 70 ppb requirement or a lowered ozone NAAQS may be subject to increased emission controls and associated costs of compliance.
The United States Congress has from time to time considered adopting legislation to reduce emissions of GHGs and many of the states have already taken legal measures to reduce emissions of GHGs primarily through the planned development of GHG emission inventories and/or regional GHG cap and trade programs. Most of these cap and trade programs work by requiring major sources of emissions, such as electric power plants, or major producers of fuels, such as refineries and gas processing plants, to acquire and surrender emission allowances. The number of allowances available for purchase is reduced each year in an effort to achieve the overall GHG emission reduction goal. In addition, there have been international conventions and efforts to establish standards for the reduction of GHGs globally, including the Paris accords in December 2015. The conditions for entry into force of the Paris accords were met on October 5, 2016 and the Agreement went into force 30 days later on November 4, 2016. At the United Nations Climate Change Conference in Glasgow in 2021, the United States and the European Union announced the Global Methane Pledge that aims to reduce methane emissions by 30 percent compared with 2020 levels.
The adoption of legislation or regulatory programs to reduce emissions of GHGs could require us to incur increased operating costs, such as costs to purchase and operate emissions control systems, to acquire emissions allowances, or comply with new regulatory or reporting requirements. Any such legislation or regulatory programs could also increase the cost of consuming, and thereby reduce demand for, the oil and gas we produce. Consequently, legislation and regulatory programs to reduce emissions of GHGs could have an adverse effect on our business, financial condition, and results of operations. Judicial challenges to new regulatory measures are likely and we cannot predict the outcome of such challenges. New regulatory suspensions, revisions, or rescissions and conflicting state and federal regulatory mandates may inhibit our ability to accurately forecast the costs associated with future regulatory compliance. Finally, scientists have concluded that increasing concentrations of GHGs in the earth’s atmosphere produce climate changes that likely have significant physical effects, such as increased frequency and severity of storms, droughts, floods, and other climatic events. Such effects could have an adverse effect on our financial condition and results of operations.
In terms of opportunities, the regulation of GHG emissions and the introduction of alternative incentives, such as enhanced oil recovery, carbon sequestration, and low carbon fuel standards, could benefit us in a variety of ways. For example, although federal regulation and climate change legislation could reduce the overall demand for the oil and gas that we produce, the relative demand for gas may increase because the burning of gas produces lower levels of emissions than other readily available fossil fuels such as oil and coal. In addition, if renewable resources such as wind or solar power become more prevalent, gas-fired electric plants may provide an alternative backup to maintain consistent electricity supply. Also, if states adopt low-carbon fuel standards, gas may become a more attractive transportation fuel. Approximately 40 percent and 35 percent of our production on a BOE basis in 2022 and 2021, respectively, was gas. Market-based incentives for the capture and storage of carbon dioxide in underground reservoirs, particularly in oil and gas reservoirs, could also benefit us through the potential to obtain GHG emission allowances or offsets from or government incentives for the sequestration of carbon dioxide.
Non-GAAP Financial Measures
Adjusted EBITDAX represents net income (loss) before interest expense, interest income, income taxes, depletion, depreciation, amortization and asset retirement obligation liability accretion expense, exploration expense, property abandonment and impairment expense, non-cash stock-based compensation expense, derivative gains and losses net of settlements, gains and losses on divestitures, gains and losses on extinguishment of debt, and certain other items. Adjusted EBITDAX excludes certain items that we believe affect the comparability of operating results and can exclude items that are generally non-recurring in nature or whose timing and/or amount cannot be reasonably estimated. Adjusted EBITDAX is a non-GAAP measure that we believe provides useful additional information to investors and analysts, as a performance measure, for analysis of our ability to internally generate funds for exploration, development, acquisitions, and to service debt. We are also subject to financial covenants under our Credit Agreement as further described in Note 5 – Long-Term Debt in Part II, Item 8 of this report. In addition, adjusted EBITDAX is widely used by professional research analysts and others in the valuation, comparison, and investment recommendations of companies in the oil and gas exploration and production industry, and many investors use the published research of industry research analysts in making investment decisions. Adjusted EBITDAX should not be considered in isolation or as a substitute for net income (loss), income (loss) from operations, net cash provided by operating activities, or other profitability or liquidity measures prepared under GAAP. Because adjusted EBITDAX excludes some, but not all items that affect net income (loss) and may vary among companies, the adjusted EBITDAX amounts presented may not be comparable to similar metrics of other companies. Our revolving credit facility provides a material source of liquidity for us. Under the terms of our Credit Agreement, if we failed to comply with the covenants that establish a maximum permitted ratio of total funded debt, as defined in the Credit Agreement, to adjusted EBITDAX, we would be in default, an event that would prevent us from borrowing under our revolving credit facility and would therefore materially limit a significant source of our liquidity. In addition, if we are in default under our revolving credit facility and are unable to obtain a waiver of that default from our lenders, lenders under that facility and under the indentures governing each series of our outstanding Senior Notes, as defined in Note 5 – Long-Term Debt in Part II, Item 8 of this report, would be entitled to exercise all of their remedies for default.
The following table provides reconciliations of our net income (loss) (GAAP) and net cash provided by operating activities (GAAP) to adjusted EBITDAX (non-GAAP) for the periods presented:
| | | | | | | | | | | | | | | | | |
| For the Years Ended December 31, |
| 2022 | | 2021 | | 2020 |
| (in thousands) |
| Net income (loss) (GAAP) | $ | 1,111,952 | | | $ | 36,229 | | | $ | (764,614) | |
| Interest expense | 120,346 | | | 160,353 | | | 163,892 | |
| Income tax expense (benefit) | 283,818 | | | 9,938 | | | (192,091) | |
| Depletion, depreciation, amortization, and asset retirement obligation liability accretion | 603,780 | | | 774,386 | | | 784,987 | |
Exploration (1) | 50,978 | | | 35,346 | | | 37,541 | |
| Impairment | 7,468 | | | 35,000 | | | 1,016,013 | |
| Stock-based compensation expense | 18,772 | | | 18,819 | | | 14,999 | |
| Net derivative (gain) loss | 374,012 | | | 901,659 | | | (161,576) | |
| Derivative settlement gain (loss) | (710,700) | | | (748,958) | | | 351,261 | |
| | | | | |
| Net (gain) loss on extinguishment of debt | 67,605 | | | 2,139 | | | (280,081) | |
| Other, net | (9,743) | | | 507 | | | 5,074 | |
| Adjusted EBITDAX (non-GAAP) | 1,918,288 | | | 1,225,418 | | | 975,405 | |
| Interest expense | (120,346) | | | (160,353) | | | (163,892) | |
| Income tax (expense) benefit | (283,818) | | | (9,938) | | | 192,091 | |
Exploration (1)(2) | (36,810) | | | (35,346) | | | (37,541) | |
| Amortization of debt discount and deferred financing costs | 10,281 | | | 17,275 | | | 17,704 | |
| Deferred income taxes | 269,057 | | | 9,565 | | | (192,540) | |
| Other, net | 1,817 | | | (4,260) | | | (11,874) | |
| Net change in working capital | (72,063) | | | 117,411 | | | 11,591 | |
| Net cash provided by operating activities (GAAP) | $ | 1,686,406 | | | $ | 1,159,772 | | | $ | 790,944 | |
____________________________________________
(1) Stock-based compensation expense is a component of the exploration expense and general and administrative expense line items on the accompanying statements of operations. Therefore, the exploration line items shown in the reconciliation above will vary from the amount shown on the accompanying statements of operations for the component of stock-based compensation expense recorded to exploration expense.
(2) For the year ended December 31, 2022, amount is net of certain capital expenditures related to unsuccessful exploration efforts outside of our core areas of operation.
ITEM 7A. QUANTITATIVE AND QUALITATIVE DISCLOSURES ABOUT MARKET RISK
The information required by this Item is provided under the captions Interest Rate Risk and Commodity Price Risk in Item 7 above, as well as under the section entitled Summary of Oil, Gas, and NGL Derivative Contracts in Place in Note 10 – Derivative Financial Instruments in Part II, Item 8 of this report and is incorporated herein by reference.
ITEM 8. CONSOLIDATED FINANCIAL STATEMENTS AND SUPPLEMENTARY DATA
Report of Independent Registered Public Accounting Firm
To the Stockholders and the Board of Directors of SM Energy Company and subsidiaries
Opinion on the Financial Statements
We have audited the accompanying consolidated balance sheets of SM Energy Company and subsidiaries (the Company) as of December 31, 2022 and 2021, the related consolidated statements of operations, comprehensive income (loss), changes in stockholders’ equity and cash flows for each of the three years in the period ended December 31, 2022, and the related notes (collectively referred to as the “consolidated financial statements”). In our opinion, the consolidated financial statements present fairly, in all material respects, the financial position of the Company at December 31, 2022 and 2021, and the results of its operations and its cash flows for each of the three years in the period ended December 31, 2022, in conformity with U.S. generally accepted accounting principles.
We also have audited, in accordance with the standards of the Public Company Accounting Oversight Board (United States) (PCAOB), the Company’s internal control over financial reporting as of December 31, 2022, based on criteria established in Internal Control-Integrated Framework issued by the Committee of Sponsoring Organizations of the Treadway Commission (2013 framework), and our report dated February 23, 2023 expressed an unqualified opinion thereon.
Basis for Opinion
These financial statements are the responsibility of the Company’s management. Our responsibility is to express an opinion on the Company’s financial statements based on our audits. We are a public accounting firm registered with the PCAOB and are required to be independent with respect to the Company in accordance with the U.S. federal securities laws and the applicable rules and regulations of the Securities and Exchange Commission and the PCAOB.
We conducted our audits in accordance with the standards of the PCAOB. Those standards require that we plan and perform the audit to obtain reasonable assurance about whether the financial statements are free of material misstatement, whether due to error or fraud. Our audits included performing procedures to assess the risks of material misstatement of the financial statements, whether due to error or fraud, and performing procedures that respond to those risks. Such procedures included examining, on a test basis, evidence regarding the amounts and disclosures in the financial statements. Our audits also included evaluating the accounting principles used and significant estimates made by management, as well as evaluating the overall presentation of the financial statements. We believe that our audits provide a reasonable basis for our opinion.
Critical Audit Matter
The critical audit matter communicated below is a matter arising from the current period audit of the financial statements that was communicated or is required to be communicated to the audit committee and that: (1) relates to accounts or disclosures that are material to the financial statements and (2) involved our especially challenging, subjective or complex judgments. The communication of the critical audit matter does not alter in any way our opinion on the consolidated financial statements, taken as a whole, and we are not, by communicating the critical audit matter below, providing a separate opinion on the critical audit matter or on the accounts or disclosures to which it relates.
Depletion, Depreciation and Amortization (“DD&A”) of Proved Oil and Gas Properties
| | | | | |
Description of the Matter | At December 31, 2022, the net book value of the Company’s proved oil and gas properties was $4.1 billion, and depletion, depreciation, amortization, and asset retirement obligation liability accretion was $603.8 million for the year then ended. As described in Note 1, under the successful efforts method of accounting, capitalized costs of proved properties are depleted using the units-of-production method based on proved reserves, as estimated by the Company’s engineers. Proved reserve estimates are impacted by various inputs, including historical production, oil and gas price assumptions, and future operating and capital cost assumptions, among others, and requires the expertise of the Company’s engineers in evaluating and interpreting the relevant data. Because of the complexity involved in estimating oil and gas reserves, management used independent petroleum engineers to audit the estimates prepared by the Company's engineers as of December 31, 2022.
Auditing the Company’s DD&A calculation is especially complex because of the use of the work of the Company’s engineers and the independent petroleum engineers and the evaluation of management’s determination of the inputs described above used by the engineers in estimating proved oil and gas reserves. |
| |
| How We Addressed the Matter in Our Audit | We obtained an understanding, evaluated the design and tested the operating effectiveness of the Company’s controls that address the risk of material misstatement relating to proved oil and gas reserves as an input to the DD&A expense calculations, including management’s controls over the completeness and accuracy of the financial data used in estimating proved oil and gas reserves. Our audit procedures included, among others, evaluating the professional qualifications and objectivity of the Company’s engineers responsible for the preparation of the reserve estimates and the independent petroleum engineers used to audit the estimates. In addition, in assessing whether we can use the work of the engineers, we evaluated the completeness and accuracy of the financial data used by the engineers, in estimating proved oil and gas reserves by agreeing significant inputs to source documentation, where available, on a sample basis, and we assessed the inputs for reasonableness based on our review of corroborative evidence and consideration of any contrary evidence. We also tested that the DD&A expense calculations, are based on appropriate proved oil and gas reserves amounts from the Company’s reserve report. |
/s/ Ernst & Young LLP
We have served as the Company’s auditor since 2012.
Denver, Colorado
February 23, 2023
SM ENERGY COMPANY AND SUBSIDIARIES
CONSOLIDATED BALANCE SHEETS
(in thousands, except share data)
| | | | | | | | | | | |
| December 31, |
| 2022 | | 2021 |
| ASSETS | | | |
| Current assets: | | | |
| Cash and cash equivalents | $ | 444,998 | | | $ | 332,716 | |
| Accounts receivable | 233,297 | | | 247,201 | |
| Derivative assets | 48,677 | | | 24,095 | |
| Prepaid expenses and other | 10,231 | | | 9,175 | |
| Total current assets | 737,203 | | | 613,187 | |
| | | |
| Property and equipment (successful efforts method): | | | |
| Proved oil and gas properties | 10,258,368 | | | 9,397,407 | |
| Accumulated depletion, depreciation, and amortization | (6,188,147) | | | (5,634,961) | |
Unproved oil and gas properties, net of valuation allowance of $38,008 and $34,934, respectively | 487,192 | | | 629,098 | |
| Wells in progress | 287,267 | | | 148,394 | |
| | | |
Other property and equipment, net of accumulated depreciation of $56,512 and $62,359, respectively | 38,099 | | | 36,060 | |
| Total property and equipment, net | 4,882,779 | | | 4,575,998 | |
| | | |
| Noncurrent assets: | | | |
| Derivative assets | 24,465 | | | 239 | |
| Other noncurrent assets | 71,592 | | | 44,553 | |
| Total noncurrent assets | 96,057 | | | 44,792 | |
| Total assets | $ | 5,716,039 | | | $ | 5,233,977 | |
| | | |
| LIABILITIES AND STOCKHOLDERS’ EQUITY | | | |
| Current liabilities: | | | |
| Accounts payable and accrued expenses | $ | 532,289 | | | $ | 563,306 | |
| Derivative liabilities | 56,181 | | | 319,506 | |
| Other current liabilities | 10,114 | | | 6,515 | |
| Total current liabilities | 598,584 | | | 889,327 | |
| | | |
| Noncurrent liabilities: | | | |
| Revolving credit facility | — | | | — | |
| Senior Notes, net | 1,572,210 | | | 2,081,164 | |
| | | |
| Asset retirement obligations | 108,233 | | | 97,324 | |
| | | |
| Deferred income taxes | 280,811 | | | 9,769 | |
| Derivative liabilities | 1,142 | | | 25,696 | |
| Other noncurrent liabilities | 69,601 | | | 67,566 | |
| Total noncurrent liabilities | 2,031,997 | | | 2,281,519 | |
| | | |
| Commitments and contingencies (note 6) | | | |
| | | |
| Stockholders’ equity: | | | |
Common stock, $0.01 par value - authorized: 200,000,000 shares; issued and outstanding: 121,931,676 and 121,862,248 shares, respectively | 1,219 | | | 1,219 | |
| Additional paid-in capital | 1,779,703 | | | 1,840,228 | |
| Retained earnings | 1,308,558 | | | 234,533 | |
| Accumulated other comprehensive loss | (4,022) | | | (12,849) | |
| Total stockholders’ equity | 3,085,458 | | | 2,063,131 | |
| Total liabilities and stockholders’ equity | $ | 5,716,039 | | | $ | 5,233,977 | |
The accompanying notes are an integral part of these consolidated financial statements.
SM ENERGY COMPANY AND SUBSIDIARIES
CONSOLIDATED STATEMENTS OF OPERATIONS
(in thousands, except per share data)
| | | | | | | | | | | | | | | | | |
| For the Years Ended
December 31, |
| 2022 | | 2021 | | 2020 |
| Operating revenues and other income: | | | | | |
| Oil, gas, and NGL production revenue | $ | 3,345,906 | | | $ | 2,597,915 | | | $ | 1,126,188 | |
| | | | | |
| Other operating income | 12,741 | | | 24,979 | | | 485 | |
| Total operating revenues and other income | 3,358,647 | | | 2,622,894 | | | 1,126,673 | |
| | | | | |
| Operating expenses: | | | | | |
| Oil, gas, and NGL production expense | 620,912 | | | 505,416 | | | 391,217 | |
| Depletion, depreciation, amortization, and asset retirement obligation liability accretion | 603,780 | | | 774,386 | | | 784,987 | |
| Exploration | 54,943 | | | 39,296 | | | 40,997 | |
| | | | | |
| | | | | |
| Impairment | 7,468 | | | 35,000 | | | 1,016,013 | |
| General and administrative | 114,558 | | | 111,945 | | | 99,160 | |
| Net derivative (gain) loss | 374,012 | | | 901,659 | | | (161,576) | |
| Other operating expense, net | 3,493 | | | 46,069 | | | 24,825 | |
| Total operating expenses | 1,779,166 | | | 2,413,771 | | | 2,195,623 | |
| | | | | |
| Income (loss) from operations | 1,579,481 | | | 209,123 | | | (1,068,950) | |
| | | | | |
| | | | | |
| Interest expense | (120,346) | | | (160,353) | | | (163,892) | |
| Net gain (loss) on extinguishment of debt | (67,605) | | | (2,139) | | | 280,081 | |
| Other non-operating income (expense), net | 4,240 | | | (464) | | | (3,944) | |
| | | | | |
| Income (loss) before income taxes | 1,395,770 | | | 46,167 | | | (956,705) | |
| Income tax (expense) benefit | (283,818) | | | (9,938) | | | 192,091 | |
| Net income (loss) | $ | 1,111,952 | | | $ | 36,229 | | | $ | (764,614) | |
| | | | | |
| Basic weighted-average common shares outstanding | 122,351 | | | 119,043 | | | 113,730 | |
| Diluted weighted-average common shares outstanding | 124,084 | | | 123,690 | | | 113,730 | |
| Basic net income (loss) per common share | $ | 9.09 | | | $ | 0.30 | | | $ | (6.72) | |
| Diluted net income (loss) per common share | $ | 8.96 | | | $ | 0.29 | | | $ | (6.72) | |
The accompanying notes are an integral part of these consolidated financial statements.
SM ENERGY COMPANY AND SUBSIDIARIES
CONSOLIDATED STATEMENTS OF COMPREHENSIVE INCOME (LOSS)
(in thousands)
| | | | | | | | | | | | | | | | | |
| For the Years Ended
December 31, |
| 2022 | | 2021 | | 2020 |
| Net income (loss) | $ | 1,111,952 | | | $ | 36,229 | | | $ | (764,614) | |
| Other comprehensive income (loss), net of tax: | | | | | |
Pension liability adjustment (1) | 8,827 | | | 749 | | | (2,279) | |
| Total other comprehensive income (loss), net of tax | 8,827 | | | 749 | | | (2,279) | |
| Total comprehensive income (loss) | $ | 1,120,779 | | | $ | 36,978 | | | $ | (766,893) | |
____________________________________________
(1) Please refer to Note 11 – Pension Benefits for additional discussion of the pension liability adjustment.
The accompanying notes are an integral part of these consolidated financial statements.
SM ENERGY COMPANY AND SUBSIDIARIES
CONSOLIDATED STATEMENTS OF STOCKHOLDERS’ EQUITY
(in thousands, except share data and dividends per share)
| | | | | | | | | | | | | | | | | | | | | | | | | | | | | | | | | | | |
| | | Additional Paid-in Capital | | | | Accumulated Other Comprehensive Loss | | Total Stockholders’ Equity |
| Common Stock | | | Retained Earnings | | |
| Shares | | Amount | | | | |
| Balances, January 1, 2020 | 112,987,952 | | | $ | 1,130 | | | $ | 1,791,596 | | | $ | 967,587 | | | $ | (11,319) | | | $ | 2,748,994 | |
| Net loss | — | | | — | | | — | | | (764,614) | | | — | | | (764,614) | |
| Other comprehensive loss | — | | | — | | | — | | | — | | | (2,279) | | | (2,279) | |
Cash dividends declared, $0.02 per share | — | | | — | | | — | | | (2,276) | | | — | | | (2,276) | |
| Issuance of common stock under Employee Stock Purchase Plan | 464,757 | | | 4 | | | 1,460 | | | — | | | — | | | 1,464 | |
| Issuance of common stock upon vesting of RSUs and settlement of PSUs, net of shares used for tax withholdings | 1,022,019 | | | 10 | | | (1,570) | | | — | | | — | | | (1,560) | |
| | | | | | | | | | | |
| Stock-based compensation expense | 267,576 | | | 3 | | | 14,996 | | | — | | | — | | | 14,999 | |
| | | | | | | | | | | |
| Issuance of Warrants | — | | | — | | | 21,520 | | | | | | | 21,520 | |
| Other | — | | | — | | | (88) | | | — | | | — | | | (88) | |
| Balances, December 31, 2020 | 114,742,304 | | | $ | 1,147 | | | $ | 1,827,914 | | | $ | 200,697 | | | $ | (13,598) | | | $ | 2,016,160 | |
| Net income | — | | | — | | | — | | | 36,229 | | | — | | | 36,229 | |
| Other comprehensive income | — | | | — | | | — | | | — | | | 749 | | | 749 | |
Cash dividends declared, $0.02 per share | — | | | — | | | — | | | (2,393) | | | — | | | (2,393) | |
| Issuance of common stock under Employee Stock Purchase Plan | 313,773 | | | 3 | | | 2,636 | | | — | | | — | | | 2,639 | |
| Issuance of common stock upon vesting of RSUs and settlement of PSUs, net of shares used for tax withholdings | 827,572 | | | 9 | | | (9,081) | | | — | | | — | | | (9,072) | |
| Stock-based compensation expense | 60,510 | | | 1 | | | 18,818 | | | — | | | — | | | 18,819 | |
| Issuance of common stock through cashless exercise of Warrants | 5,918,089 | | | 59 | | | (59) | | | — | | | — | | | — | |
| | | | | | | | | | | |
| Balances, December 31, 2021 | 121,862,248 | | | $ | 1,219 | | | $ | 1,840,228 | | | $ | 234,533 | | | $ | (12,849) | | | $ | 2,063,131 | |
| Net income | — | | | — | | | — | | | 1,111,952 | | | — | | | 1,111,952 | |
| Other comprehensive income | — | | | — | | | — | | | — | | | 8,827 | | | 8,827 | |
Cash dividends declared, $0.31 per share | — | | | — | | | — | | | (37,927) | | | — | | | (37,927) | |
| Issuance of common stock under Employee Stock Purchase Plan | 113,785 | | | 1 | | | 3,038 | | | — | | | — | | | 3,039 | |
| Issuance of common stock upon vesting of RSUs and settlement of PSUs, net of shares used for tax withholdings | 1,291,427 | | | 13 | | | (25,142) | | | — | | | — | | | (25,129) | |
| Stock-based compensation expense | 29,471 | | | — | | | 18,772 | | | — | | | — | | | 18,772 | |
| | | | | | | | | | | |
| Purchase of shares under Stock Repurchase Program | (1,365,255) | | | (14) | | | (57,193) | | | — | | | — | | | (57,207) | |
| Balances, December 31, 2022 | 121,931,676 | | | $ | 1,219 | | | $ | 1,779,703 | | | $ | 1,308,558 | | | $ | (4,022) | | | $ | 3,085,458 | |
The accompanying notes are an integral part of these consolidated financial statements.
SM ENERGY COMPANY AND SUBSIDIARIES
CONSOLIDATED STATEMENTS OF CASH FLOWS
(in thousands)
| | | | | | | | | | | | | | | | | |
| For the Years Ended
December 31, |
| 2022 | | 2021 | | 2020 |
| Cash flows from operating activities: | | | | | |
| Net income (loss) | $ | 1,111,952 | | | $ | 36,229 | | | $ | (764,614) | |
| Adjustments to reconcile net income (loss) to net cash provided by operating activities: | | | | | |
| | | | | |
| Depletion, depreciation, amortization, and asset retirement obligation liability accretion | 603,780 | | | 774,386 | | | 784,987 | |
| Impairment | 7,468 | | | 35,000 | | | 1,016,013 | |
| Stock-based compensation expense | 18,772 | | | 18,819 | | | 14,999 | |
| Net derivative (gain) loss | 374,012 | | | 901,659 | | | (161,576) | |
| Derivative settlement gain (loss) | (710,700) | | | (748,958) | | | 351,261 | |
| Amortization of debt discount and deferred financing costs | 10,281 | | | 17,275 | | | 17,704 | |
| Net (gain) loss on extinguishment of debt | 67,605 | | | 2,139 | | | (280,081) | |
| Deferred income taxes | 269,057 | | | 9,565 | | | (192,540) | |
| Other, net | 6,242 | | | (3,753) | | | (6,800) | |
| Changes in working capital: | | | | | |
| Accounts receivable | 38,554 | | | (101,047) | | | 29,100 | |
| Prepaid expenses and other | (1,055) | | | 220 | | | 5,873 | |
| Accounts payable and accrued expenses | (109,562) | | | 218,238 | | | (23,382) | |
| Net cash provided by operating activities | 1,686,406 | | | 1,159,772 | | | 790,944 | |
| | | | | |
| Cash flows from investing activities: | | | | | |
| | | | | |
| Capital expenditures | (879,934) | | | (674,841) | | | (547,785) | |
| | | | | |
| Other, net | (329) | | | 7,606 | | | (7,781) | |
| Net cash used in investing activities | (880,263) | | | (667,235) | | | (555,566) | |
| | | | | |
| Cash flows from financing activities: | | | | | |
| Proceeds from revolving credit facility | — | | | 1,832,500 | | | 1,447,000 | |
| Repayment of revolving credit facility | — | | | (1,925,500) | | | (1,476,500) | |
| Net proceeds from Senior Notes | — | | | 392,771 | | | — | |
| Cash paid to repurchase Senior Notes | (584,946) | | | (450,776) | | | (189,998) | |
| Repurchase of common stock | (57,207) | | | — | | | — | |
| Net proceeds from sale of common stock | 3,039 | | | 2,639 | | | 1,464 | |
| Dividends paid | (19,637) | | | (2,393) | | | (2,276) | |
| Net share settlement from issuance of stock awards | (25,129) | | | (9,072) | | | (1,560) | |
| Other, net | (9,981) | | | — | | | (13,508) | |
| Net cash used in financing activities | (693,861) | | | (159,831) | | | (235,378) | |
| | | | | |
| Net change in cash, cash equivalents, and restricted cash | 112,282 | | | 332,706 | | | — | |
| Cash, cash equivalents, and restricted cash at beginning of period | 332,716 | | | 10 | | | 10 | |
| Cash, cash equivalents, and restricted cash at end of period | $ | 444,998 | | | $ | 332,716 | | | $ | 10 | |
| | | | | |
| Supplemental schedule of additional cash flow information and non-cash activities: | | | | | |
| Operating activities: | | | | | |
| Cash paid for interest, net of capitalized interest | $ | (134,240) | | | $ | (136,606) | | | $ | (140,493) | |
| Net cash (paid) refunded for income taxes | $ | (10,576) | | | $ | (864) | | | $ | 6,664 | |
| Investing activities: | | | | | |
| Increase (decrease) in capital expenditure accruals and other | $ | 29,789 | | | $ | (10,826) | | | $ | (7,965) | |
Non-cash financing activities (1) | | | | | |
| | | | | |
| | | | | |
____________________________________________
(1) Please refer to Note 5 – Long-Term Debt for discussion of the debt transactions completed during the years ended December 31, 2022, 2021, and 2020.
The accompanying notes are an integral part of these consolidated financial statements.
SM ENERGY COMPANY AND SUBSIDIARIES
NOTES TO CONSOLIDATED FINANCIAL STATEMENTS
Note 1 – Summary of Significant Accounting Policies
Description of Operations
SM Energy Company, together with its consolidated subsidiaries, is an independent energy company currently engaged in the acquisition, exploration, development, and production of oil, gas, and NGLs in the state of Texas.
Basis of Presentation
The accompanying consolidated financial statements include the accounts of the Company and have been prepared in accordance with GAAP and the instructions to Form 10-K and Regulation S-X. Intercompany accounts and transactions have been eliminated. In connection with the preparation of the accompanying consolidated financial statements, the Company evaluated events subsequent to the balance sheet date of December 31, 2022, through the filing of this report. Additionally, certain prior period amounts have been reclassified to conform to current period presentation in the accompanying consolidated financial statements.
Use of Estimates in the Preparation of Financial Statements
The preparation of financial statements in conformity with GAAP requires management to make estimates and assumptions that affect the reported amounts of proved oil and gas reserves, assets and liabilities, disclosure of contingent assets and liabilities at the date of the financial statements, and the reported amounts of revenues and expenses during the reporting period. Actual results could differ from those estimates. Estimates of proved oil and gas reserve quantities provide the basis for the calculation of DD&A expense, impairment of proved and unproved oil and gas properties, and asset retirement obligations, each of which represents a significant component of the accompanying consolidated financial statements.
Cash and Cash Equivalents
The Company considers all liquid investments purchased with an initial maturity of three months or less and deposits in money market mutual funds that are readily convertible into cash to be cash equivalents. The carrying value of cash and cash equivalents approximates fair value due to the short-term nature of these instruments.
Accounts Receivable
The Company’s accounts receivable primarily consist of receivables due from oil, gas, and NGL purchasers and from joint interest owners on properties the Company operates. For receivables due from joint interest owners, the Company generally has the ability to withhold future revenue disbursements to recover non-payment of joint interest billings. Generally, the Company’s oil, gas, and NGL receivables are collected within 30 to 90 days and the Company has had minimal bad debts. Although diversified among many companies, collectability is dependent upon the financial wherewithal of each individual company and is influenced by the general economic conditions of the industry. Receivables are not collateralized. Please refer to Note 13 – Accounts Receivable and Accounts Payable and Accrued Expenses for additional disclosure.
Concentration of Credit Risk and Major Customers
The Company is exposed to credit risk in the event of nonpayment by counterparties, a significant portion of which are concentrated in energy related industries. The creditworthiness of customers and other counterparties is subject to regular review.
The Company does not believe the loss of any single purchaser of its production would materially impact its operating results, as oil, gas, and NGLs are products with well-established markets and numerous purchasers in the Company’s operating areas. The following major customers and entities under common control accounted for 10 percent or more of the Company’s total oil, gas, and NGL production revenue for at least one of the periods presented:
| | | | | | | | | | | | | | | | | |
| For the Years Ended December 31, |
| 2022 | | 2021 | | 2020 |
| Major customer #1 | 24 | % | | 27 | % | | 15 | % |
| Major customer #2 | 8 | % | | 15 | % | | 24 | % |
| Major customer #3 | 7 | % | | 9 | % | | 20 | % |
| Group #1 of entities under common control | 24 | % | | 18 | % | | 6 | % |
The Company only contracts with the affiliates of the lenders under its Credit Agreement as its derivative counterparties, and the Company’s policy is that each counterparty must have certain minimum investment grade senior unsecured debt ratings.
The Company maintains its primary bank accounts with a large, multinational bank that has branch locations in the Company’s areas of operation. The Company’s policy is to diversify its concentration of cash and cash equivalent investments among multiple institutions and investment products to limit the amount of credit exposure to any single institution or investment.
Oil and Gas Producing Activities
Proved properties. The Company follows the successful efforts method of accounting for its oil and gas properties. Under this method, property acquisition costs and development costs are capitalized when incurred. Capitalized drilling and completion costs, including lease and well equipment, intangible development costs, and operational support facilities in the field, are depleted on an asset group basis (properties aggregated based on geographical and geological characteristics) using the units-of-production method based on estimated proved developed oil and gas reserves. Similarly, proved leasehold costs are depleted on the same asset group basis; however, the units-of-production method is based on estimated total proved oil and gas reserves. The computation of DD&A expense takes into consideration restoration, dismantlement, and abandonment costs as well as the anticipated proceeds from salvaging equipment.
Proved oil and gas property costs are evaluated for impairment on a pool-by-pool basis and reduced to fair value when there is an indication that associated carrying costs may not be recoverable. The Company uses Level 3 inputs and the income valuation technique, which converts future cash flows to a single present value amount, to measure the fair value of proved properties using a discount rate, price and cost forecasts, and certain reserve risk-adjustment factors, as selected by the Company’s management. The Company uses a discount rate that represents a current market-based weighted average cost of capital. The discount rate typically ranges from 10 percent to 15 percent. The prices for oil and gas are forecast based on NYMEX strip pricing, adjusted for basis differentials, for the first five years, after which a flat terminal price is used for each commodity stream. The prices for NGLs are forecast using OPIS Mont Belvieu pricing, adjusted for basis differentials, for as long as the market is actively trading, after which a flat terminal price is used. Future operating costs are also adjusted as deemed appropriate for these estimates. Certain undeveloped reserve estimates are also risk-adjusted given the risk to related projected cash flows due to performance and exploitation uncertainties.
The partial sale of a proved property within an existing field is accounted for as a normal retirement and no net gain or loss on divestiture activity is recognized as long as the treatment does not significantly affect the units-of-production depletion rate. The sale of a partial interest in an individual proved property is accounted for as a recovery of cost. A net gain or loss on divestiture activity is recognized in the accompanying statements of operations for all other sales of proved properties.
Unproved properties. The unproved oil and gas properties line item on the accompanying consolidated balance sheets (“accompanying balance sheets”) consists of the costs incurred to acquire unproved leases. Leasehold costs allocated to those leases, or partial leases that have associated proved reserves recorded, are reclassified to proved properties and depleted on an asset group basis using the units-of-production method based on estimated total proved oil and gas reserves. Unproved oil and gas property costs are evaluated for impairment and reduced to fair value when there is an indication that the carrying costs may not be recoverable. Lease acquisition costs that are not individually significant are aggregated by asset group and the portion of such costs estimated to be nonproductive prior to lease expiration are recognized as a valuation allowance and amortized over the appropriate period. The estimate of what could be nonproductive is based on historical trends or other information, including current drilling plans and the Company’s intent to renew leases. To measure the fair value of unproved properties, the Company uses a market approach, which takes into account the following significant assumptions: remaining lease terms, future development plans, risk-weighted potential resource recovery, estimated reserve values, and estimated acreage value based on price(s) received for similar, recent acreage transactions by the Company or other market participants.
For the sale of unproved properties where the original cost has been partially or fully amortized by providing a valuation allowance on an asset group basis, neither a gain nor loss is recognized unless the sales price exceeds the original cost of the property, in which case a gain shall be recognized in the accompanying statements of operations in the amount of such excess.
Exploratory. Exploratory geological and geophysical, including exploratory seismic studies, and the costs of carrying and retaining unproved acreage are expensed as incurred. Under the successful efforts method of accounting for oil and gas properties, exploratory well costs are initially capitalized pending the determination of whether proved reserves have been discovered. If proved reserves are discovered, exploratory well costs will be capitalized as proved properties and will be accounted for following the successful efforts method of accounting described above. If proved reserves are not found, exploratory well costs are expensed as dry holes. The application of the successful efforts method of accounting requires management’s judgment to determine the proper designation of wells as either development or exploratory, which will ultimately determine the proper accounting treatment of costs of dry holes. Once a well is drilled, the determination that proved reserves have been discovered may take considerable time and judgment. Exploratory dry hole costs are included in the cash flows from investing activities section as part of capital expenditures within the accompanying statements of cash flows.
Please refer to Note 8 – Fair Value Measurements for additional information.
Other Property and Equipment
Other property and equipment such as facilities, office furniture and equipment, buildings, and computer hardware and software are recorded at cost. The Company capitalizes certain software costs incurred during the application development stage. The application development stage generally includes software design, configuration, testing, and installation activities. Costs of renewals and improvements that substantially extend the useful lives of the assets are capitalized. Maintenance and repair costs are expensed when incurred. Depreciation is calculated using either the straight-line method over the estimated useful lives of the assets, which range from three to 30 years, or the unit of output method when appropriate. When other property and equipment is sold or retired, the capitalized costs and related accumulated depreciation are removed from the Company’s accounts.
Other property and equipment costs are evaluated for impairment and reduced to fair value when there is an indication the carrying costs may not be recoverable. To measure the fair value of other property and equipment, the Company uses an income valuation technique or market approach depending on the quality of information available to support management’s assumptions and the circumstances. The valuation includes consideration of the proved and unproved assets supported by the property and equipment, future cash flows associated with the assets, and fixed costs necessary to operate and maintain the assets.
Asset Retirement Obligations
The Company recognizes an estimated liability for future costs associated with the abandonment of its oil and gas properties, including facilities requiring decommissioning. A liability for the fair value of an asset retirement obligation and corresponding increase to the carrying value of the related long-lived asset are recorded at the time a well is drilled or acquired, or a facility is constructed. The increase in carrying value is included in the proved oil and gas properties line item in the accompanying balance sheets. The Company depletes the amount added to proved oil and gas property costs and recognizes expense in connection with the accretion of the discounted liability over the remaining estimated economic lives of the respective long-lived assets. Cash paid to settle asset retirement obligations is included in the cash flows from operating activities section of the accompanying statements of cash flows.
The Company’s estimated asset retirement obligation liability is based on historical experience in plugging and abandoning wells, estimated economic lives, estimated plugging and abandonment cost, and federal and state regulatory requirements. The liability is discounted using the credit-adjusted risk-free rate estimated at the time the liability is incurred or revised. The credit-adjusted risk-free rates used to discount the Company’s plugging and abandonment liabilities range from 5.5 percent to 12 percent. In periods subsequent to initial measurement of the liability, the Company must recognize period-to-period changes in the liability resulting from the passage of time, revisions to either the amount of the original estimate of undiscounted cash flows or economic life, changes in inflation factors, or the Company’s credit-adjusted risk-free rate as market conditions warrant. Please refer to Note 14 – Asset Retirement Obligations for a reconciliation of the Company’s total asset retirement obligation liability as of December 31, 2022, and 2021.
Derivative Financial Instruments
The Company periodically enters into commodity derivative instruments to mitigate a portion of its exposure to oil, gas, and NGL price volatility and location differentials for its expected future oil, gas, and NGL production, and the associated impact on cash flows. These instruments typically include commodity price swaps and collar arrangements, as well as, basis swaps and roll differential swaps. Commodity derivative instruments are measured at fair value and are included in the accompanying balance sheets as derivative assets and liabilities, with the exception of derivative instruments that meet the “normal purchase normal sale” exclusion. The Company does not designate its commodity derivative contracts as hedging instruments. Accordingly, the Company reflects changes in the fair value of its derivative instruments in its accompanying statements of operations as they occur. Gains and losses on derivatives are included within the cash flows from operating activities section of the accompanying statements of cash flows. Please refer to Note 10 – Derivative Financial Instruments for additional discussion.
Revenue Recognition
The Company derives revenue predominately from the sale of produced oil, gas, and NGLs. Revenue is recognized at the point in time when custody and title (“control”) of the product transfers to the purchaser, which may differ depending on the applicable contractual terms. Revenue accruals are recorded monthly and are based on estimated production delivered to a purchaser and the expected price to be received. The Company uses knowledge of its properties, contractual arrangements, historical performance, NYMEX, local spot market, and OPIS prices, and other factors as the basis of these estimates. Variances between estimates and the actual amounts received are recorded in the month payment is received. Please refer to Note 2 - Revenue from Contracts with Customers for additional discussion.
Stock-Based Compensation
At December 31, 2022, the Company had stock-based employee compensation plans that included RSUs and PSUs issued to employees, RSUs and restricted stock issued to non-employee directors, and an employee stock purchase plan available to eligible employees. The Company records expense associated with the fair value of stock-based compensation in accordance with
authoritative accounting guidance, which is based on the estimated fair value of these awards determined at the time of grant, and is included within the general and administrative and exploration expense line items in the accompanying statements of operations. For stock-based compensation awards containing non-market based performance conditions, the Company evaluates the probability of the number of shares that are expected to vest, and then adjusts the expense to reflect the number of shares expected to vest and the cumulative vesting period met to date. Further, the Company accounts for forfeitures of stock-based compensation awards as they occur. Please refer to Note 7 – Compensation Plans for additional discussion.
Income Taxes
The Company accounts for deferred income taxes whereby deferred tax assets and liabilities are recognized based on the tax effects of temporary differences between the carrying amounts on the accompanying consolidated financial statements and the tax basis of assets and liabilities, as measured using current enacted tax rates. These differences will result in taxable income or deductions in future years when the reported amounts of the assets or liabilities are recorded or settled, respectively. The Company records deferred tax assets and associated valuation allowances, when appropriate, to reflect amounts more likely than not to be realized based upon Company analysis. The cumulative effect of enacted tax rate changes on the net balance of reported amounts of assets and liabilities is recognized in the period of enactment. Please refer to Note 4 – Income Taxes for additional discussion.
Earnings per Share
The Company uses the treasury stock method to determine the effect of potentially dilutive instruments. Please refer to Note 9 - Earnings Per Share for additional discussion.
Comprehensive Income (Loss)
Comprehensive income (loss) is used to refer to net income (loss) plus other comprehensive income (loss). Other comprehensive income (loss) is comprised of revenues, expenses, gains, and losses that under GAAP are reported as separate components of stockholders’ equity instead of net income (loss). Comprehensive income (loss) is presented net of income taxes in the accompanying consolidated statements of comprehensive income (loss). The Company’s policy for releasing income tax effects within accumulated other comprehensive loss is an incremental, unit-of-account approach. Please refer to Note 11 – Pension Benefits for detail on the changes in the balances of components comprising other comprehensive income (loss).
Fair Value of Financial Instruments
The Company’s financial instruments including cash and cash equivalents, accounts receivable, and accounts payable are carried at cost, which approximates fair value due to the short-term maturity of these instruments. The Company’s Senior Notes, as defined in Note 5 – Long-Term Debt, are recorded at cost, net of any unamortized discount and deferred financing costs, and their respective fair values are disclosed in Note 8 – Fair Value Measurements. The Company’s Warrants, as defined in Note 3 - Equity, were recorded at fair value upon issuance, with no recurring fair value measurement required. Additionally, the Company has derivative financial instruments that are recorded at fair value. Considerable judgment is required to develop estimates of fair value. The estimates provided are not necessarily indicative of the amounts the Company would realize upon the sale or refinancing of such instruments.
Leases
The Company accounts for leases in accordance with ASC Topic 842, Leases, (“Topic 842”), which requires lessees to recognize operating and finance leases with terms greater than 12 months on the balance sheet. The Company evaluates a contractual arrangement at its inception to determine if it is a lease or contains an identifiable lease component. Certain leases may contain both lease and non-lease components. The Company’s policy for all asset classes is to combine lease and non-lease components together and account for the arrangement as a single lease.
Certain assumptions and judgments made by the Company when evaluating a contract that meets the definition of a lease under Topic 842 include those to determine the discount rate and lease term. Unless implicitly defined, the Company determines the present value of future lease payments using an estimated incremental borrowing rate based on a yield curve analysis that factors in certain assumptions, including the term of the lease and credit rating of the Company at lease inception. The Company evaluates each contract containing a lease arrangement at inception to determine the length of the lease term when recognizing a right-of-use (“ROU”) asset and corresponding lease liability. When determining the lease term, options available to extend or early terminate the arrangement are evaluated and included when it is reasonably certain an option will be exercised. Exercising an early termination option may result in an early termination penalty depending on the terms of the underlying agreement. The Company excludes from the balance sheet leases with terms that are less than one year.
An ROU asset represents a lessee’s right to use an underlying asset for the lease term, while the associated lease liability represents the lessee’s obligations to make lease payments. At the commencement date, which is the date on which a lessor makes an underlying asset available for use by a lessee, a lease ROU asset and corresponding lease liability is recognized based on the
present value of the future lease payments. The initial measurement of lease payments may also be adjusted for certain items, including options that are reasonably certain to be exercised, such as options to purchase the asset at the end of the lease term, or options to extend or early terminate the lease. Excluded from the initial measurement of an ROU asset and corresponding lease liability are certain variable lease payments, such as payments made that vary depending on actual usage or performance.
Subsequent to initial measurement, costs associated with the Company’s operating leases are either expensed or capitalized depending on how the underlying ROU asset is utilized and in accordance with GAAP requirements. When calculating the Company’s ROU asset and liability for a contractual arrangement that qualifies as an operating lease, the Company considers all of the necessary payments made or that are expected to be made upon commencement of the lease. As discussed above, excluded from the initial measurement are certain variable lease payments, which for the Company’s drilling rigs, completion crews, and midstream agreements, may be a significant component of the total lease costs. Please refer to Note 12 - Leases for additional discussion.
Industry Segment and Geographic Information
The Company operates in the exploration and production segment of the oil and gas industry, onshore in the United States. The Company reports as a single industry segment.
Off-Balance Sheet Arrangements
The Company has not participated in transactions that generate relationships with unconsolidated entities or financial partnerships, such as entities often referred to as structured finance or SPEs, which would have been established for the purpose of facilitating off-balance sheet arrangements or other contractually narrow or limited purposes.
The Company evaluates its transactions to determine if any variable interest entities exist. If it is determined that the Company is the primary beneficiary of a variable interest entity, that entity is consolidated into the Company’s consolidated financial statements. The Company has not been involved in any unconsolidated SPE transactions during 2022 or 2021, or through the filing of this report.
Recently Issued Accounting Standards
In September 2022, the FASB issued ASU No. 2022-04, Liabilities - Supplier Finance Programs (Subtopic 405-50): Disclosure of Supplier Finance Program Obligations (“ASU 2022-04”). ASU 2022-04 was issued to enhance the transparency of supplier finance programs and implement explicit GAAP disclosure requirements for those programs. The guidance is to be applied retrospectively to each period in which a balance sheet is presented, except for the amendment on rollforward information, which is to be applied prospectively. ASU 2022-04 is effective for fiscal years beginning after December 15, 2022, including interim periods within those fiscal years, except for the amendment on rollforward information, which is effective for fiscal years beginning after December 15, 2023. Early adoption is permitted. ASU 2022-04 is currently not applicable to the Company.
As of December 31, 2022, and through the filing of this report, no other ASUs have been issued and not yet adopted that are applicable to the Company and that would have a material effect on the Company’s consolidated financial statements and related disclosures.
Note 2 - Revenue from Contracts with Customers
The Company recognizes its share of revenue from the sale of produced oil, gas, and NGLs from its Midland Basin and South Texas assets. Oil, gas, and NGL production revenue presented within the accompanying statements of operations is reflective of the revenue generated from contracts with customers.
The tables below present oil, gas, and NGL production revenue by product type for each of the Company’s operating areas for the years ended December 31, 2022, 2021, and 2020:
| | | | | | | | | | | | | | | | | |
| For the year ended December 31, 2022 |
| Midland Basin | | South Texas | | Total |
| (in thousands) |
| Oil production revenue | $ | 1,816,597 | | | $ | 453,471 | | | $ | 2,270,068 | |
| Gas production revenue | 432,831 | | | 358,049 | | | 790,880 | |
| NGL production revenue | 986 | | | 283,972 | | | 284,958 | |
| Total | $ | 2,250,414 | | | $ | 1,095,492 | | | $ | 3,345,906 | |
| Relative percentage | 67 | % | | 33 | % | | 100 | % |
| | | | | | | | | | | | | | | | | |
| For the year ended December 31, 2021 |
| Midland Basin | | South Texas | | Total |
| (in thousands) |
| Oil production revenue | $ | 1,701,915 | | | $ | 189,911 | | | $ | 1,891,826 | |
| Gas production revenue | 326,115 | | | 199,364 | | | 525,479 | |
| NGL production revenue | 381 | | | 180,229 | | | 180,610 | |
| Total | $ | 2,028,411 | | | $ | 569,504 | | | $ | 2,597,915 | |
| Relative percentage | 78 | % | | 22 | % | | 100 | % |
| | | | | | | | | | | | | | | | | | | |
| For the year ended December 31, 2020 |
| Midland Basin | | South Texas | | | | Total |
| (in thousands) |
| Oil production revenue | $ | 802,494 | | | $ | 51,074 | | | | | $ | 853,568 | |
| Gas production revenue | 76,759 | | | 110,700 | | | | | 187,459 | |
| NGL production revenue | 324 | | | 84,837 | | | | | 85,161 | |
| Total | $ | 879,577 | | | $ | 246,611 | | | | | $ | 1,126,188 | |
| Relative percentage | 78 | % | | 22 | % | | | | 100 | % |
The Company recognizes oil, gas, and NGL production revenue at the point in time when control of the product transfers to the purchaser, which differs depending on the applicable contractual terms. Transfer of control drives the presentation of transportation, gathering, processing, and other post-production expenses (“fees and other deductions”) within the accompanying statements of operations. Fees and other deductions incurred by the Company prior to control transfer are recorded within the oil, gas, and NGL production expense line item on the accompanying statements of operations. When control is transferred at or near the wellhead, sales are based on a wellhead market price that is impacted by fees and other deductions incurred by the purchaser subsequent to the transfer of control. In general, the Company generates production revenue from a combination of the following types of contracts:
•The Company sells oil and gas production at or near the wellhead and receives an agreed-upon market price from the purchaser. Under this type of arrangement, control transfers at or near the wellhead.
•The Company has certain processing arrangements that include the delivery of unprocessed gas to a midstream processor’s facility for processing. Upon completion of processing, the midstream processor purchases the NGLs and redelivers residue gas back to the Company in-kind. For the NGLs extracted during processing, the midstream processor remits payment to the Company. For the residue gas taken in-kind, the Company has separate sales contracts where control transfers at points downstream of the processing facility. The Company also has certain oil sales that occur at market locations downstream of the production area. Given the structure of these arrangements and where control transfers, the Company separately recognizes fees and other deductions incurred prior to control transfer. These fees are recorded within the oil, gas, and NGL production expense line item on the accompanying statements of operations.
Significant judgments made in applying the guidance in ASC Topic 606, Revenue from Contracts with Customers, relate to the point in time when control transfers to purchasers in gas processing arrangements with midstream processors. The Company does not believe that significant judgments are required with respect to the determination of the transaction price, including amounts that represent variable consideration, as volume and price carry a low level of estimation uncertainty given the precision of volumetric measurements and the use of index pricing with generally predictable differentials. Accordingly, the Company does not consider estimates of variable consideration to be constrained.
The Company’s performance obligations arise upon the production of hydrocarbons from wells in which the Company has an ownership interest. The performance obligations are considered satisfied upon control transferring to a purchaser at the wellhead, inlet, or tailgate of the midstream processor’s processing facility, or other contractually specified delivery point. The time period between production and satisfaction of performance obligations is generally less than one day; thus, there are no material unsatisfied or partially unsatisfied performance obligations at the end of the reporting period.
Revenue is recorded in the month when performance obligations are satisfied. However, settlement statements from the purchasers of hydrocarbons and the related cash consideration are received 30 to 90 days after production has occurred. As a result, the Company must estimate the amount of production delivered to its customers and the consideration that will ultimately be received for sale of the product. Estimated revenue due to the Company is recorded within the accounts receivable line item on the accompanying balance sheets until payment is received. The accounts receivable balances from contracts with customers within the accompanying balance sheets as of December 31, 2022, and 2021, were $184.5 million and $215.6 million, respectively. To estimate accounts receivable from contracts with customers, the Company uses knowledge of its properties, historical performance, contractual arrangements, index pricing, quality and transportation differentials, and other factors as the basis for these estimates. Differences
between estimates and actual amounts received for product sales are recorded in the month that payment is received from the purchaser.
Note 3 - Equity
Stock Repurchase Program
On September 7, 2022, the Company announced that its Board of Directors approved the Stock Repurchase Program authorizing the Company to repurchase up to $500.0 million in aggregate value of its common stock through December 31, 2024. The Stock Repurchase Program permits the Company to repurchase shares of its common stock from time to time in open market transactions, through privately negotiated transactions or by other means in accordance with federal securities laws and subject to certain provisions of the Credit Agreement and the indentures governing the Senior Notes, as defined in Note 5 – Long-Term Debt. The Company intends to fund repurchases with net cash provided by operating activities. Stock repurchases may also be funded with borrowings under the Credit Agreement. The timing, as well as the number and value of shares repurchased under the Stock Repurchase Program, will be determined by certain authorized officers of the Company at their discretion and will depend on a variety of factors, including the market price of the Company’s common stock, general market and economic conditions and applicable legal requirements. The value of shares authorized for repurchase by the Board of Directors does not require the Company to repurchase such shares or guarantee that such shares will be repurchased, and the Stock Repurchase Program may be suspended, modified, or discontinued at any time without prior notice. No assurance can be given that any particular number or dollar value of its shares will be repurchased by the Company. The Stock Repurchase Program terminates and supersedes the August 1998 authorization to repurchase common stock, under which 3,072,184 shares remained available for repurchase prior to termination.
During the year ended December 31, 2022, the Company repurchased and subsequently retired 1,365,255 shares of its common stock at a weighted-average share price of $41.88 for a total cost of $57.2 million, excluding commissions and fees. As of December 31, 2022, $442.8 million remained available for repurchases of the Company’s outstanding common stock under the Stock Repurchase Program. Effective January 1, 2023, shares of common stock repurchased, net of shares of common stock issued, will be subject to a one percent excise tax imposed by the IRA.
Warrants
On June 17, 2020, in connection with the Exchange Offers described below in Note 5 – Long-Term Debt, the Company issued warrants to purchase up to an aggregate of approximately 5.9 million shares, or approximately five percent of its then outstanding common stock, at an exercise price of $0.01 per share (“Warrants”). The Warrants became exercisable at the election of the holders on January 15, 2021, pursuant to the terms of the Warrant Agreement, dated June 17, 2020 (“Warrant Agreement”), and the remaining unexercised warrants remain exercisable at the election of the holders until their expiration on June 30, 2023. The Warrants are indexed to the Company’s common stock and are required to be settled through physical settlement or net share settlement, if exercised.
Upon issuance, the $21.5 million fair value of the Warrants was recorded in additional paid-in capital on the accompanying balance sheets, and was determined using a stochastic Monte Carlo simulation using geometric Brownian motion (“GBM Model”). The Company evaluated the Warrants under authoritative accounting guidance and determined that they should be classified as equity instruments, with no recurring fair value measurement required. There have been no changes to the initial carrying amount of the Warrants since issuance.
No Warrants were exercised during the year ended December 31, 2022. During 2021, the Company issued 5,918,089 shares of common stock as a result of the cashless exercise of 5,922,260 Warrants at a weighted-average share price of $15.45 per share, as determined under the terms of the Warrant Agreement. At the request of stockholders and pursuant to the Company’s obligations under the Warrant Agreement, a registration statement covering the resale of a majority of these shares was filed with the SEC on June 11, 2021.
Dividends
During the third quarter of 2022, the Company’s Board of Directors approved an increase to the Company’s fixed dividend to $0.60 per share annually, to be paid in quarterly increments of $0.15 per share. During the year ended December 31, 2022, cash dividends declared totaled $37.9 million.
Note 4 – Income Taxes
The provision for income taxes consists of the following:
| | | | | | | | | | | | | | | | | |
| For the Years Ended December 31, |
| 2022 | | 2021 | | 2020 |
| (in thousands) |
| Current portion of income tax (expense) benefit | | | | | |
| Federal | $ | (9,230) | | | $ | — | | | $ | — | |
| State | (5,531) | | | (373) | | | (449) | |
| Deferred portion of income tax (expense) benefit | (269,057) | | | (9,565) | | | 192,540 | |
| Income tax (expense) benefit | $ | (283,818) | | | $ | (9,938) | | | $ | 192,091 | |
| | | | | |
| Effective tax rate | 20.3 | % | | 21.5 | % | | 20.1 | % |
The components of the net deferred tax liabilities are as follows:
| | | | | | | | | | | |
| As of December 31, |
| 2022 | | 2021 |
| (in thousands) |
| Deferred tax liabilities | | | |
| Oil and gas properties excluding asset retirement obligation liabilities | $ | 358,537 | | | $ | 117,085 | |
| Derivative assets | 3,416 | | | — | |
| | | |
| Other | 6,059 | | | 4,835 | |
| Total deferred tax liabilities | 368,012 | | | 121,920 | |
| Deferred tax assets | | | |
| Federal and state tax net operating loss carryovers | 28,151 | | | 3,299 | |
| Asset retirement obligation liabilities | 24,899 | | | 21,899 | |
| Interest carryforward | 22,667 | | | — | |
| Lease liabilities | 4,525 | | | 4,496 | |
| Pension | 3,970 | | | 7,413 | |
| Stock compensation | 567 | | | 2,246 | |
| Credit carryover | 161 | | | 897 | |
| Debt discount and deferred financing costs | 59 | | | 20,551 | |
| Derivative liabilities | — | | | 69,283 | |
| Other liabilities | 3,818 | | | 528 | |
| Total deferred tax assets | 88,817 | | | 130,612 | |
| Valuation allowance | (1,616) | | | (18,461) | |
| Net deferred tax assets | 87,201 | | | 112,151 | |
| Total net deferred tax liabilities | $ | 280,811 | | | $ | 9,769 | |
| | | |
| Current federal income tax refundable | $ | 770 | | | $ | — | |
| | | |
| Current state income tax payable | $ | 5,316 | | | $ | 362 | |
As of December 31, 2022, the Company had estimated federal net operating loss (“NOL”) carryforwards of $121.7 million, state NOL carryforwards of $3.3 million that expire between 2023 and 2037, and de minimus state tax credits that expire between 2023 and 2031. The Company expects to utilize the federal R&D credit carryforward from 2021. The Company commissioned a multi-year R&D credit study, which is expected to be completed in late 2023, and is likely to favorably impact the Company’s effective tax rate when the results are recorded. The Company’s policy is to not record an R&D credit until it is claimed on a filed tax return, which had not occurred at the time of this filing.
The Company’s current valuation allowance includes an amount for state NOL carryforwards and state tax credits, which are expected to expire before they can be utilized. The change in the valuation allowance as of December 31, 2021, compared with December 31, 2022, primarily relates to the change in the Company’s net derivative position from liabilities to assets and to estimated future reversals of existing taxable temporary differences, which support the realization of the remaining deductible temporary differences and carryforwards. Cumulative financial statement income exceeds cumulative financial statement losses for the periods included in the Company’s accompanying statements of operations, which reinforces the Company’s decision to not maintain a valuation allowance for certain deferred tax assets as of December 31, 2022.
Recorded income tax expense or benefit differs from the amount that would be provided by applying the statutory United States federal income tax rate to income or loss before income taxes. These differences primarily relate to the effect of state income taxes, excess tax benefits and deficiencies from stock-based compensation awards, tax deduction limitations on compensation of covered individuals, changes in valuation allowances, the cumulative impact of other smaller permanent differences, and can also reflect the cumulative effect of an enacted tax rate change, in the period of enactment, on the Company’s net deferred tax asset and liability balances. These differences are reported as follows:
| | | | | | | | | | | | | | | | | |
| For the Years Ended December 31, |
| 2022 | | 2021 | | 2020 |
| (in thousands) |
| Federal statutory tax (expense) benefit | $ | (293,112) | | | $ | (9,695) | | | $ | 200,908 | |
| (Increase) decrease in tax resulting from: | | | | | |
| Change in valuation allowance | 16,845 | | | (5,073) | | | (10,318) | |
| | | | | |
| Employee share-based compensation | 10,861 | | | 3,080 | | | (2,578) | |
| Return to provision | (2,183) | | | 1,230 | | | (857) | |
| Compensation of covered individuals | (6,297) | | | (1,216) | | | (719) | |
| State tax (expense) benefit (net of federal benefit) | (9,870) | | | (211) | | | 5,722 | |
Other | (62) | | | 1,947 | | | (67) | |
| Income tax (expense) benefit | $ | (283,818) | | | $ | (9,938) | | | $ | 192,091 | |
Acquisitions, divestitures, drilling activity, and basis differentials, which impact the prices received for oil, gas, and NGLs, impact the apportionment of taxable income to the states where the Company owns oil and gas properties. As these factors change, the Company’s state income tax rate changes. This change, when applied to the Company’s total temporary differences, impacts the total state income tax (expense) benefit reported in the current year. Items affecting state apportionment factors are evaluated upon completion of the prior year income tax return, after significant acquisitions and divestitures, if there are significant changes in drilling activity, or if estimated state revenue changes occur during the year.
For all years before 2019, the Company is generally no longer subject to United States federal or state income tax examinations by tax authorities.
The Company complies with authoritative accounting guidance regarding uncertain tax provisions. The entire amount of unrecognized tax benefit reported by the Company would affect its effective tax rate if recognized. Interest expense in the accompanying statements of operations includes a negligible amount associated with income taxes. The total amount recorded for unrecognized tax benefits for each of the years ended December 31, 2022, 2021, and 2020, was $0.4 million. The Company does not expect a significant change to the recorded unrecognized tax benefits in 2023, except for any potential change related to the Company’s R&D credit study discussed above.
Note 5 – Long-Term Debt
Credit Agreement
On August 2, 2022, the Company entered into a Seventh Amended and Restated Credit Agreement by and among the Company, Wells Fargo Bank, National Association, as Administrative Agent and Swingline Lender, and the institutions named therein as lenders. The Credit Agreement provides for a senior secured revolving credit facility with a maximum loan amount of $3.0 billion. As of December 31, 2022, the borrowing base and aggregate lender commitments were $2.5 billion and $1.25 billion, respectively. The revolving credit facility is secured by substantially all of the Company’s proved oil and gas properties. The borrowing base is subject to regular, semi-annual redetermination, and considers the value of both the Company’s proved oil and gas properties reflected in the Company’s most recent reserve report; and commodity derivative contracts, each as determined by the Company’s lender group. The next scheduled borrowing base redetermination date is April 1, 2023. The Credit Agreement is scheduled to mature on the earlier of August 2, 2027 (“Stated Maturity Date”), or 91 days prior to the maturity date of any of the Company’s outstanding Senior Notes, as defined below, to the extent that, on or before such date, the respective Senior Notes have not been repaid, exchanged, repurchased, refinanced, or otherwise redeemed in full, and, if refinanced or exchanged, with a scheduled maturity date that is not earlier than at
least 180 days after the Stated Maturity Date. In addition to other terms, conditions, agreements, and provisions, the Credit Agreement establishes SOFR as the benchmark for determining interest rates. The financial covenants under the Credit Agreement are discussed under Covenants below.
Interest and commitment fees associated with the revolving credit facility are accrued based on a borrowing base utilization grid set forth in the Credit Agreement, as presented in the table below. At the Company’s election, borrowings under the Credit Agreement may be in the form of SOFR, Alternate Base Rate (“ABR”), or Swingline loans. SOFR loans accrue interest at SOFR plus the applicable margin from the utilization grid, and ABR and Swingline loans accrue interest at a market-based floating rate, plus the applicable margin from the utilization grid. Commitment fees are accrued on the unused portion of the aggregate lender commitment amount at rates from the utilization grid.
| | | | | | | | | | | | | | | | | | | | | | | | | | | | | |
| Borrowing Base Utilization Percentage | <25% | | ≥25% <50% | | ≥50% <75% | | ≥75% <90% | | ≥90% |
SOFR Loans | 2.000 | % | | 2.250 | % | | 2.500 | % | | 2.750 | % | | 3.000 | % |
ABR Loans or Swingline Loans | 1.000 | % | | 1.250 | % | | 1.500 | % | | 1.750 | % | | 2.000 | % |
| Commitment Fee Rate | 0.375 | % | | 0.375 | % | | 0.500 | % | | 0.500 | % | | 0.500 | % |
The following table presents the outstanding balance, total amount of letters of credit outstanding, and available borrowing capacity under the Credit Agreement as of February 9, 2023, December 31, 2022, and December 31, 2021:
| | | | | | | | | | | | | | | | | |
| As of February 9, 2023 | | As of December 31, 2022 | | As of December 31, 2021 |
| (in thousands) |
Revolving credit facility (1) | $ | — | | | $ | — | | | $ | — | |
Letters of credit (2) | 6,000 | | | 6,000 | | | 2,500 | |
| Available borrowing capacity | 1,244,000 | | | 1,244,000 | | | 1,097,500 | |
| Total aggregate lender commitment amount | $ | 1,250,000 | | | $ | 1,250,000 | | | $ | 1,100,000 | |
____________________________________________
(1) Unamortized deferred financing costs attributable to the revolving credit facility are presented as a component of the other noncurrent assets line item on the accompanying balance sheets and totaled $10.8 million and $2.7 million as of December 31, 2022, and 2021, respectively. These costs are being amortized over the term of the revolving credit facility on a straight-line basis.
(2) Letters of credit outstanding reduce the amount available under the revolving credit facility on a dollar-for-dollar basis.
Senior Secured Notes
No Senior Secured Notes were outstanding as of December 31, 2022. Senior Secured Notes, net of unamortized discount and deferred financing costs, included within the Senior Notes, net line item on the accompanying balance sheets as of December 31, 2021, consisted of the following:
| | | | | | | |
| | | As of December 31, 2021 |
| | | (in thousands) |
| | | |
Principal amount of 10.0% Senior Secured Notes due 2025 | | | $ | 446,675 | |
| Unamortized debt discount | | | 30,236 | |
| Unamortized deferred financing costs | | | 8,727 | |
10.0% Senior Secured Notes due 2025, net of unamortized debt discount and deferred financing costs | | | $ | 407,712 | |
2025 Senior Secured Notes. On June 17, 2020, the Company issued $446.7 million in aggregate principal amount of 10.0% Senior Secured Notes (“2025 Senior Secured Notes” or “Senior Secured Notes”), at par, with a maturity date of January 15, 2025. The Company incurred fees of $13.1 million, and recorded $405.0 million as the initial carrying amount, which approximated the fair value of the 2025 Senior Secured Notes at issuance. The excess of the principal amount of the 2025 Senior Secured Notes over its fair value was recorded as a debt discount. The debt discount and deferred financing costs were being amortized to interest expense until the early redemption of the 2025 Senior Secured Notes in 2022, as discussed below.
2021 Senior Secured Convertible Notes. On August 12, 2016, the Company issued $172.5 million in aggregate principal amount of 1.50% Senior Convertible Notes with a maturity date of July 1, 2021 (“2021 Senior Convertible Notes”). Upon issuance of the 2021 Senior Convertible Notes, the Company received net proceeds of $166.6 million after deducting fees of $5.9 million. The Company recorded $132.3 million as the initial carrying amount of the debt component, which approximated its fair value at issuance, and the $40.2 million excess of the principal amount of the 2021 Senior Convertible Notes over the fair value of the debt component was recorded as a debt discount and a corresponding increase in additional paid-in capital. The debt discount and deferred financing
costs were amortized to interest expense through the maturity date. Upon the closing of the Exchange Offers, discussed and defined below, on June 17, 2020, the remaining outstanding 2021 Senior Convertible Notes became secured and are subsequently referred to as “2021 Senior Secured Convertible Notes”. The 2021 Senior Secured Convertible Notes were fully redeemed in 2021, as discussed below.
Interest expense recognized on the 2021 Senior Secured Convertible Notes related to the stated interest rate and amortization of the debt discount and debt related issuance costs totaled $2.3 million and $7.7 million for the years ended December 31, 2021, and 2020, respectively.
Senior Unsecured Notes
Senior Unsecured Notes, net of unamortized deferred financing costs, included within the Senior Notes, net line item on the accompanying balance sheets as of December 31, 2022, and 2021, consisted of the following (collectively referred to as “Senior Unsecured Notes”, and together with the 2025 Senior Secured Notes, “Senior Notes”):
| | | | | | | | | | | | | | | | | | | | | | | | | | | | | | | | | | | |
| As of December 31, 2022 | | As of December 31, 2021 |
| Principal Amount | | Unamortized Deferred Financing Costs | | Principal Amount, Net | | Principal Amount | | Unamortized Deferred Financing Costs | | Principal Amount, Net |
| (in thousands) |
5.0% Senior Notes due 2024 | $ | — | | | $ | — | | | $ | — | | | $ | 104,769 | | | $ | 403 | | | $ | 104,366 | |
5.625% Senior Notes due 2025 | 349,118 | | | 1,528 | | | 347,590 | | | 349,118 | | | 2,160 | | | 346,958 | |
6.75% Senior Notes due 2026 | 419,235 | | | 2,569 | | | 416,666 | | | 419,235 | | | 3,270 | | | 415,965 | |
6.625% Senior Notes due 2027 | 416,791 | | | 3,172 | | | 413,619 | | | 416,791 | | | 3,949 | | | 412,842 | |
6.5% Senior Notes due 2028 | 400,000 | | | 5,665 | | | 394,335 | | | 400,000 | | | 6,679 | | | 393,321 | |
| Total | $ | 1,585,144 | | | $ | 12,934 | | | $ | 1,572,210 | | | $ | 1,689,913 | | | $ | 16,461 | | | $ | 1,673,452 | |
The Senior Unsecured Notes listed above are unsecured senior obligations and rank equal in right of payment with all of the Company’s existing and any future unsecured senior debt and are senior in right of payment to any future subordinated debt. The Company may redeem some or all of its Senior Unsecured Notes prior to their maturity at redemption prices based on a premium, plus accrued and unpaid interest as described in the indentures governing the Senior Unsecured Notes. Fees incurred upon issuance of each series of Senior Unsecured Notes are being amortized as deferred financing costs over the life of the respective notes, unless earlier redeemed or retired, in which case amortization has been proportionately accelerated.
2022 Senior Notes. On November 17, 2014, the Company issued $600.0 million in aggregate principal amount of 6.125% Senior Notes due 2022, at par, with a maturity date of November 15, 2022 (“2022 Senior Notes”). The Company received net proceeds of $590.0 million after deducting fees of $10.0 million. The 2022 Senior Notes were fully redeemed in 2021, as discussed below.
2024 Senior Notes. On May 20, 2013, the Company issued $500.0 million in aggregate principal amount of 5.0% Senior Notes due 2024, at par, with a maturity date of January 15, 2024 (“2024 Senior Notes”). The Company received net proceeds of $490.2 million after deducting fees of $9.8 million. The 2024 Senior Notes were fully redeemed in 2022, as discussed below.
2025 Senior Notes. On May 21, 2015, the Company issued $500.0 million in aggregate principal amount of 5.625% Senior Notes due 2025, at par, which mature on June 1, 2025. The Company received net proceeds of $491.0 million after deducting fees of $9.0 million.
2026 Senior Notes. On September 12, 2016, the Company issued $500.0 million in aggregate principal amount of 6.75% Senior Notes due 2026, at par, which mature on September 15, 2026 (“2026 Senior Notes”). The Company received net proceeds of $491.6 million after deducting fees of $8.4 million.
2027 Senior Notes. On August 20, 2018, the Company issued $500.0 million in aggregate principal amount of 6.625% Senior Notes due 2027, at par, which mature on January 15, 2027 (“2027 Senior Notes”). The Company received net proceeds of $492.1 million after deducting fees of $7.9 million.
2028 Senior Notes. On June 23, 2021, the Company issued $400.0 million in aggregate principal amount of 6.5% Senior Notes due 2028, at par, which mature on July 15, 2028 (“2028 Senior Notes”). The Company received net proceeds of $392.8 million after deducting fees of $7.2 million.
Senior Notes Activity
2022 Senior Notes Transactions. On February 14, 2022, the Company redeemed the remaining $104.8 million of aggregate principal amount outstanding of its 2024 Senior Notes, with cash on hand, pursuant to the terms of the indenture governing the 2024 Senior Notes which provided for a redemption price equal to 100 percent of the principal amount of the 2024 Senior Notes on the date of redemption, plus accrued and unpaid interest. The Company canceled all redeemed 2024 Senior Notes upon settlement.
On June 17, 2022, the Company redeemed all of the $446.7 million of aggregate principal amount outstanding of its 2025 Senior Secured Notes with cash on hand, at a redemption price equal to 107.5 percent of the principal amount outstanding on the date of the redemption, plus accrued and unpaid interest. Upon redemption, the Company recorded a net loss on extinguishment of debt of $67.2 million which included $33.5 million of premium paid, $26.3 million of accelerated expense recognition of the unamortized debt discount, and $7.4 million of accelerated expense recognition of the remaining unamortized deferred financing costs. The Company canceled all redeemed 2025 Senior Secured Notes upon settlement.
2021 Senior Notes Transactions. On June 23, 2021, the Company issued $400.0 million in aggregate principal amount of its 2028 Senior Notes, as described above. The net proceeds of $392.8 million were used to repurchase $193.1 million and $172.3 million of outstanding principal amount of the Company’s 2022 Senior Notes and 2024 Senior Notes, respectively, through a cash tender offer (“Tender Offer”), and to redeem the remaining $19.3 million of 2022 Senior Notes not repurchased as part of the Tender Offer (“2022 Senior Notes Redemption”). The Company paid total consideration, excluding accrued interest, of $385.3 million, and recorded a net loss on extinguishment of debt of $2.1 million for the year ended December 31, 2021, which included the accelerated expense recognition of $1.5 million of the remaining unamortized deferred financing costs and $0.6 million of net premiums. The Company canceled all repurchased and redeemed 2022 Senior Notes and 2024 Senior Notes upon settlement.
The 2021 Senior Secured Convertible Notes matured on July 1, 2021, and on that day, the Company used borrowings under its revolving credit facility to retire, at par, the remaining outstanding principal amount of $65.5 million.
2020 Senior Notes Transactions. During the second quarter of 2020, the Company initiated an offer to exchange certain of its then outstanding Senior Unsecured Notes, other than its 2021 Senior Convertible Notes, (and together with the Senior Unsecured Notes, “Old Notes”), and entered into a private exchange of certain of its then outstanding 2021 Senior Convertible Notes and portions of its then outstanding Senior Unsecured Notes (“Private Exchange”), in each case, for newly issued 2025 Senior Secured Notes, referred to together as “Exchange Offers.”
On June 17, 2020, the Company exchanged $611.9 million in aggregate principal amount of Senior Unsecured Notes and $107.0 million in aggregate principal amount of 2021 Senior Convertible Notes for $446.7 million in aggregate principal amount of 2025 Senior Secured Notes. Further, in connection with the Private Exchange, the Company tendered $53.5 million in cash to certain holders of the 2021 Senior Convertible Notes and issued the Warrants. Please refer to Note 3 - Equity for more information regarding the Warrants. Upon the closing of the Exchange Offers, the Company recorded a net gain on extinguishment of debt of $227.3 million which included the accelerated expense recognition of $6.1 million and $5.6 million of previously unamortized debt discount and deferred financing costs, respectively.
Upon the closing of the Exchange Offers, the Company retired $611.9 million in aggregate principal amount of its Senior Unsecured Notes. Portions of the then-outstanding principal amount of each series of the Senior Unsecured Notes listed below were tendered and retired in connection with the Exchange Offers. The following table summarizes the principal amounts of the Senior Unsecured Notes tendered as of the Settlement Date:
| | | | | | | | |
| Title of Senior Unsecured Notes Tendered | | Principal Amount of Senior Unsecured Notes Tendered |
| | (in thousands) |
6.125% Senior Notes due 2022 | | $ | 141,701 | |
5.0% Senior Notes due 2024 | | 155,339 | |
5.625% Senior Notes due 2025 | | 150,882 | |
6.75% Senior Notes due 2026 | | 80,765 | |
6.625% Senior Notes due 2027 | | 83,209 | |
Total | | $ | 611,896 | |
The Company canceled all 2021 Senior Convertible Notes and Senior Unsecured Notes that were retired upon closing of the Exchange Offers.
Additionally, during 2020, in open market transactions, the Company repurchased a total of $122.7 million and $67.6 million in aggregate principal amount of its 2022 Senior Notes and 2024 Senior Notes, respectively, for a total settlement amount, excluding accrued interest, of $136.5 million. In connection with the repurchases, the Company recorded a net gain on extinguishment of debt of
$52.8 million for the year ended December 31, 2020. This amount included discounts realized upon repurchase of $53.8 million partially offset by approximately $1.0 million related to the accelerated expense recognition of the previously unamortized deferred financing costs. The Company canceled all repurchased 2022 Senior Notes and 2024 Senior Notes upon settlement.
Covenants
The Company is subject to certain financial and non-financial covenants under the Credit Agreement and the indentures governing the Senior Notes that, among other terms, limit the Company’s ability to incur additional indebtedness, make restricted payments including dividends, sell assets, create liens that secure debt, enter into transactions with affiliates, merge or consolidate with other entities, and with respect to the Company’s restricted subsidiaries, permit the consensual restriction on the ability of such restricted subsidiaries to pay dividends or indebtedness owing to the Company or to any other restricted subsidiaries. The financial covenants under the Credit Agreement require that the Company’s (a) total funded debt, as defined in the Credit Agreement, to 12-month trailing adjusted EBITDAX ratio cannot be greater than 3.50 to 1.00 on the last day of each fiscal quarter; and (b) adjusted current ratio, as defined in the Credit Agreement, cannot be less than 1.00 to 1.00 as of the last day of any fiscal quarter. The Company was in compliance with all covenants under the Credit Agreement and the indentures governing the Senior Notes as of December 31, 2022, and through the filing of this report.
Capitalized Interest
Capitalized interest costs for the years ended December 31, 2022, 2021, and 2020, totaled $17.6 million, $15.0 million, and $15.8 million, respectively. The amount of interest the Company capitalizes generally fluctuates based on the amount borrowed, the Company’s capital program, and the timing and amount of costs associated with capital projects that are considered in progress. Capitalized interest costs are included in total costs incurred. Please refer to Costs Incurred in Supplemental Oil and Gas Information (unaudited) in Part II, Item 8 of this report.
Note 6 – Commitments and Contingencies
Commitments
As of December 31, 2022, the Company had entered into various agreements, which included drilling rig contracts of $24.7 million, gathering, processing, transportation throughput, and delivery commitments of $45.7 million, office leases, including maintenance, of $36.8 million, fixed price contracts to purchase electricity of $31.0 million, sand sourcing agreements of approximately $20.8 million, compression service contracts of $13.2 million, and other miscellaneous contracts and leases of $13.8 million. As of December 31, 2022, the annual minimum payments for the next five years and total minimum payments thereafter are presented below:
| | | | | | | | |
| For the Years Ending December 31, | | Amount |
| | (in thousands) |
| 2023 | | $ | 98,286 | |
| 2024 | | 26,837 | |
| 2025 | | 22,229 | |
| 2026 | | 16,317 | |
| 2027 | | 6,372 | |
| Thereafter | | 15,947 | |
| Total | | $ | 185,988 | |
Drilling Rig and Completion Service Contracts. The Company has drilling rig and completion service contracts in place to facilitate its drilling and completion plans. As of December 31, 2022, the Company’s drilling rig commitments totaled $24.7 million under contract terms extending through the third quarter of 2023. If all of these contracts were terminated as of December 31, 2022, the Company would avoid a portion of the contractual service commitments; however, the Company would be required to pay $14.7 million in early termination fees. Excluded from these amounts are variable commitments and potential penalties determined by the number of completion crews the Company has in operation in a particular area under a completion service agreement. As of December 31, 2022, potential penalties under this completion service agreement, which expires on December 31, 2023, range from zero to a maximum of $3.4 million. No material expenses related to early termination or standby fees were incurred by the Company during the year ended December 31, 2022, and the Company does not expect to incur material penalties with regard to its drilling rig and completion service contracts during 2023.
Pipeline Transportation Commitments. The Company has gathering, processing, transportation throughput, and delivery commitments with various third-parties that require delivery of a minimum amount of oil, gas, and produced water. As of December 31, 2022, the Company had commitments to deliver a minimum of 18 MMBbl of oil through 2026, 26 Bcf of gas through the first half of 2023, and 11 MMBbl of produced water through 2027. The Company would be required to make periodic deficiency payments for any
shortfalls in delivering the minimum volume commitments under certain agreements. As of December 31, 2022, if the Company failed to deliver any product, as applicable, the aggregate undiscounted deficiency payments would total approximately $45.7 million. This amount does not include deficiency payment estimates associated with approximately 5 MMBbl of future oil delivery commitments where the Company cannot predict with accuracy the amount and timing of these payments, as such payments are dependent upon the price of oil in effect at the time of settlement. The Company expects to fulfill the delivery commitments from a combination of production from existing productive wells, future development of proved undeveloped reserves, and future development of resources not yet characterized as proved reserves. Under certain of the Company’s commitments, if the Company is unable to deliver the minimum quantity from its production, it may deliver production acquired from third-parties to satisfy its minimum volume commitments. As of the filing of this report, the Company does not expect to incur material shortfalls with regard to these commitments.
Office Leases. The Company leases office space under various operating leases totaling $36.8 million, including maintenance, with certain terms extending into 2033. Rent expense for the years ended December 31, 2022, 2021, and 2020, was $3.5 million, $4.8 million, and $5.4 million, respectively.
Electrical Power Purchase Contracts. As of December 31, 2022, the Company had fixed price contracts for the purchase of electrical power through 2027 with a total remaining obligation of $31.0 million.
Sand Purchase Commitments. As of December 31, 2022, the Company had a sand purchase agreement with a minimum purchase commitment of approximately $20.8 million through December 31, 2023. As of December 31, 2022, if the Company failed to purchase the minimum amount required by the contract, it would be subject to penalties of up to $4.9 million. Additionally, as of December 31, 2022, the Company had a sand sourcing agreement with potential penalties ranging from zero to a maximum of $10.0 million that vary based on the amount of sand the Company uses in well completions occurring in certain areas through March 31, 2024. As of the filing of this report, the Company does not expect to incur penalties with regard to these agreements.
Compression Service Contracts. As of December 31, 2022, the Company had compression service contracts with terms extending through 2025 for equipment being used in field operations with a total remaining obligation of $13.2 million.
Drilling and Completion Commitments. During 2022, the Company entered into an agreement that includes minimum drilling and completion footage requirements on certain existing leases. If these minimum requirements are not satisfied by March 31, 2024, the Company will be required to pay liquidated damages based on the difference between the actual footage drilled and completed and the minimum requirements. As of December 31, 2022, the liquidated damages could range from zero to a maximum of $60.3 million, with the maximum exposure assuming no additional development activity occurred prior to March 31, 2024. As of the filing of this report, the Company does not expect to incur material liquidated damages with regard to this agreement.
Contingencies
The Company is subject to litigation and claims arising in the ordinary course of business. The Company accrues for such items when a liability is both probable and the amount can be reasonably estimated. In the opinion of management, the anticipated results of any pending litigation and claims are not expected to have a material effect on the results of operations, the financial position, or the cash flows of the Company.
Note 7 – Compensation Plans
As of December 31, 2022, approximately 3.8 million shares of common stock were available for grant under the Equity Plan. The issuance of a direct share benefit, such as a share of common stock, a stock option, a restricted share, an RSU or a PSU, counts as one share against the number of shares available to be granted under the Equity Plan. Each PSU has the potential to count as two shares against the number of shares available to be granted under the Equity Plan based on the final performance multiplier. The Company may also grant other types of long-term incentive-based awards, such as cash awards and performance-based cash awards, to eligible employees.
Performance Share Units
The Company has granted PSUs to eligible employees as part of its Equity Plan. The number of shares of the Company’s common stock issued to settle PSUs ranges from zero to two times the number of PSUs awarded and is determined based on certain criteria over a three-year performance period. PSUs generally vest on the third anniversary of the date of the grant or upon other triggering events as set forth in the Equity Plan. Employees who were retirement eligible on the grant date of the 2022 PSU award vest in pro-rata increments on a daily basis over the three-year performance period beginning at the grant date, and any non-vested portions of a PSU award will be forfeited if the employee leaves the Company.
The fair value of PSUs is measured at the grant date using a stochastic Monte Carlo simulation using the GBM Model. A stochastic process is a mathematically defined equation that can create a series of outcomes over time. These outcomes are not deterministic in nature, which means that by iterating the equations multiple times, different results will be obtained for each iteration. In the case of the Company’s PSUs, the Company cannot predict with certainty the path its stock price or the stock prices of its peers will
take over the three-year performance period. By using a stochastic simulation, the Company can create multiple prospective stock pathways, statistically analyze these simulations, and ultimately make inferences regarding the path the stock price may take. As such, because future stock prices are stochastic, or probabilistic with some direction in nature, the stochastic method, specifically the GBM Model, is deemed an appropriate method by which to determine the fair value of the PSUs. Significant assumptions used in this simulation include the Company’s expected volatility, dividend yield, and risk-free interest rate based on U.S. Treasury yield curve rates with maturities consistent with a three-year vesting period, as well as the volatilities and dividend yields for each of the Company’s peers.
For PSUs granted in 2019, which the Company determined to be equity awards, the settlement criteria included a combination of the Company’s Total Shareholder Return (“TSR”) relative to the TSR of certain peer companies and the Company’s cash return on total capital invested (“CRTCI”) relative to the CRTCI of certain peer companies over the associated three-year performance period. In addition to these performance criteria, the award agreements for these grants also stipulated that if the Company’s absolute TSR was negative over the three-year performance period, the maximum number of shares of common stock that could be issued to settle outstanding PSUs was capped at one times the number of PSUs granted on the award date, regardless of the Company’s TSR and CRTCI performance relative to its peer group. The fair value of the PSUs granted in 2019 was measured on the grant date using the GBM Model, with the assumption that the associated CRTCI performance condition would be met at the target amount at the end of the performance period. PSUs granted in 2019 fully vested in 2022 and were settled as presented below.
For PSUs granted in 2022, which the Company determined to be equity awards, settlement will be determined based on a combination of the following criteria measured over the three-year performance period: the Company’s TSR relative to the TSR of certain peer companies, the Company’s absolute TSR, free cash flow (“FCF”) generation, and the achievement of certain ESG targets, in each case as defined by the award agreement. The relative and absolute TSR portions of the fair value of the PSUs granted in 2022 were measured on the grant date using the GBM Model. The portion of the awards associated with FCF generation and ESG performance conditions assumes that target amounts will be met at the end of the performance period. As these awards depend on a combination of performance-based settlement criteria and market-based settlement criteria, compensation expense may be adjusted in future periods because the number of units expected to vest increases or decreases based on the Company’s expected FCF generation and achievement of certain ESG targets.
The Company initially records compensation expense associated with the issuance of PSUs based on the fair value of the awards as of the grant date and may adjust compensation expense in future periods as discussed above. Compensation expense for PSUs is recognized within general and administrative expense and exploration expense over the vesting periods of the respective awards. Total compensation expense recorded for PSUs was $2.6 million, $6.0 million, and $4.4 million for the years ended December 31, 2022, 2021, and 2020, respectively. As of December 31, 2022, there was $6.1 million of total unrecognized expense related to non-vested PSUs, which is being amortized through mid-2025.
The fair value of PSUs granted in 2022 was $7.4 million and the fair value of PSUs that vested during the years ended December 31, 2022, 2021, and 2020, was $12.3 million, $8.4 million, and $12.6 million, respectively.
A summary of activity is presented in the following table:
| | | | | | | | | | | | | | | | | | | | | | | | | | | | | | | | | | | |
| For the Years Ended December 31, |
| 2022 | | 2021 | | 2020 |
| PSUs (1) | | Weighted-Average Grant-Date Fair Value | | PSUs (1) | | Weighted-Average Grant-Date Fair Value | | PSUs (1) | | Weighted-Average Grant-Date Fair Value |
| Non-vested at beginning of year | 464,483 | | | $ | 12.80 | | | 830,464 | | | $ | 17.52 | | | 2,022,585 | | | $ | 16.87 | |
| Granted | 276,010 | | | $ | 26.67 | | | — | | | $ | — | | | — | | | $ | — | |
| Vested | (461,387) | | | $ | 12.81 | | | (352,395) | | | $ | 23.81 | | | (792,572) | | | $ | 15.85 | |
| Forfeited | (5,848) | | | $ | 18.24 | | | (13,586) | | | $ | 15.46 | | | (399,549) | | | $ | 17.56 | |
| Non-vested at end of year | 273,258 | | | $ | 26.67 | | | 464,483 | | | $ | 12.80 | | | 830,464 | | | $ | 17.52 | |
____________________________________________
(1)The number of shares of common stock assumes a multiplier of one. The actual final number of shares of common stock to be issued will range from zero to two times the number of PSUs awarded depending on the three-year performance multiplier.
A summary of the shares of common stock issued to settle PSUs is presented in the table below:
| | | | | | | | | | | | | | | | | |
| For the Years Ended December 31, |
| 2022 | | 2021 | | 2020 |
Shares of common stock issued to settle PSUs (1) | 1,004,410 | | | 347,742 | | | 700,511 | |
| Less: shares of common stock withheld for income and payroll taxes | (349,487) | | | (112,919) | | | (215,451) | |
| Net shares of common stock issued | 654,923 | | | 234,823 | | | 485,060 | |
| | | | | |
| Multiplier earned | 2.0 | | 1.0 | | 0.9 |
____________________________________________
(1) During the years ended December 31, 2022, 2021, and 2020, the Company settled PSUs that were granted in 2019, 2018, and 2017, respectively. The Company and all eligible recipients in 2022 and 2021, and the majority of eligible recipients in 2020, mutually agreed to net share settle a portion of the awards to cover income and payroll tax withholdings, as provided for in the Equity Plan and applicable award agreements.
Employee Restricted Stock Units
The Company has granted RSUs to eligible employees as part of its Equity Plan. Each RSU represents a right to receive one share of the Company’s common stock upon settlement of the award at the end of the specified vesting period. RSUs generally vest in one-third increments on each anniversary date of the grant date over the applicable vesting period or upon other triggering events as set forth in the Equity Plan. Employees who are retirement eligible at the time an RSU award is granted generally vest in six-month increments over the applicable vesting period beginning at the grant date. Retirement eligible employees must stay with the Company through the entire six-month vesting period to receive that increment of vesting and any non-vested portions of an RSU award will be forfeited when the employee leaves the Company.
The Company records compensation expense associated with the issuance of RSUs based on the fair value of the awards as of the grant date. The fair value of an RSU is equal to the closing price of the Company’s common stock on the date of the grant. Compensation expense for RSUs is recognized within general and administrative expense and exploration expense over the vesting periods of the respective awards. Total compensation expense recorded for RSUs for the years ended December 31, 2022, 2021, and 2020, was $13.5 million, $10.2 million, and $8.7 million, respectively. As of December 31, 2022, there was $24.4 million of total unrecognized compensation expense related to non-vested RSUs, which is being amortized through mid-2025.
The fair value of RSUs granted to eligible employees in 2022, 2021 and 2020, was $18.0 million, $17.0 million, and $8.7 million, respectively, and the fair value of RSUs that vested during the years ended December 31, 2022, 2021, and 2020, was $11.2 million, $9.3 million, and $12.5 million, respectively.
A summary of activity is presented in the following table:
| | | | | | | | | | | | | | | | | | | | | | | | | | | | | | | | | | | |
| For the Years Ended December 31, |
| 2022 | | 2021 | | 2020 |
| RSUs | | Weighted-
Average
Grant-Date
Fair Value | | RSUs | | Weighted-
Average
Grant-Date
Fair Value | | RSUs | | Weighted-
Average
Grant-Date
Fair Value |
Non-vested at beginning of year | 1,841,237 | | | $ | 13.79 | | | 2,097,860 | | | $ | 8.83 | | | 1,532,131 | | | $ | 16.01 | |
| Granted | 526,776 | | | $ | 34.08 | | | 666,052 | | | $ | 25.52 | | | 1,458,869 | | | $ | 5.98 | |
| Vested | (920,927) | | | $ | 12.17 | | | (843,098) | | | $ | 11.00 | | | (746,132) | | | $ | 16.74 | |
| Forfeited | (72,034) | | | $ | 18.24 | | | (79,577) | | | $ | 10.64 | | | (147,008) | | | $ | 15.34 | |
Non-vested at end of year | 1,375,052 | | | $ | 22.42 | | | 1,841,237 | | | $ | 13.79 | | | 2,097,860 | | | $ | 8.83 | |
A summary of the shares of common stock issued to settle RSUs is presented in the table below:
| | | | | | | | | | | | | | | | | |
| For the Years Ended December 31, |
| 2022 | | 2021 | | 2020 |
Shares of common stock issued to settle RSUs (1) | 920,927 | | | 843,098 | | | 746,132 | |
| Less: shares of common stock withheld for income and payroll taxes | (284,423) | | | (250,349) | | | (209,173) | |
| Net shares of common stock issued | 636,504 | | | 592,749 | | | 536,959 | |
____________________________________________
(1) During the years ended December 31, 2022, 2021, and 2020, the Company issued shares of common stock to settle RSUs that related to awards granted in previous years. The Company and all eligible recipients in 2022 and 2021, and the majority of eligible recipients in 2020, mutually agreed to net share settle a portion of the awards to cover income and payroll tax withholdings in accordance with the Company’s Equity Plan and individual award agreements.
Director Shares
In 2022, 2021, and 2020, the Company issued a total of 29,471, 60,510, and 267,576 shares, respectively, of its common stock to its non-employee directors under the Equity Plan. For the years ended December 31, 2022, 2021, and 2020, the Company recorded $1.5 million, $1.2 million, and $1.0 million, respectively, of compensation expense related to director shares. All shares issued to non-employee directors fully vest on December 31 of the year granted.
Employee Stock Purchase Plan
Under the Company’s Employee Stock Purchase Plan (“ESPP”), eligible employees may purchase shares of the Company’s common stock through payroll deductions of up to 15 percent of eligible compensation, subject to a maximum of 2,500 shares per offering period and a maximum of $25,000 in value related to purchases for each calendar year. The purchase price of the common stock is 85 percent of the lower of the trading price of the common stock on either the first or last day of the six-month offering period. The ESPP is intended to qualify as an “employee stock purchase plan” under Section 423 of the IRC. The Company had approximately 3.4 million shares of its common stock available for issuance under the ESPP as of December 31, 2022. There were a total of 113,785, 313,773, and 464,757 shares issued under the ESPP in 2022, 2021, and 2020, respectively. Total proceeds to the Company for the issuance of these shares was $3.0 million, $2.6 million, and $1.5 million, for the years ended December 31, 2022, 2021, and 2020, respectively.
The fair value of ESPP grants is measured at the grant date using the Black-Scholes option-pricing model. Expected volatility is calculated based on the Company’s historical daily common stock price, and the risk-free interest rate is based on U.S. Treasury yield curve rates with maturities consistent with a six-month vesting period.
The fair value of ESPP shares issued during the periods reported above were estimated using the following weighted-average assumptions:
| | | | | | | | | | | | | | | | | |
| For the Years Ended December 31, |
| 2022 | | 2021 | | 2020 |
| Risk free interest rate | 1.2 | % | | 0.8 | % | | 0.8 | % |
| Dividend yield | 0.1 | % | | 0.3 | % | | 0.7 | % |
| Volatility factor of the expected market price of the Company’s common stock | 69.1 | % | | 106.1 | % | | 166.2 | % |
| Expected life (in years) | 0.5 | | 0.5 | | 0.5 |
For the years ended December 31, 2022, 2021, and 2020, the Company expensed $1.2 million, $1.4 million, and $0.9 million, respectively, based on the estimated fair value of the ESPP grants.
401(k) Plan
The Company has a defined contribution plan (“401(k) Plan”) that is subject to the Employee Retirement Income Security Act of 1974. The 401(k) Plan allows eligible employees to contribute a maximum of 60 percent of their base salaries up to the contribution limits established under the IRC. The Company matches either 100 percent or 150 percent of each employee’s contributions, depending on pension plan eligibility, up to six percent of the employee’s base salary and performance bonus, and may make additional contributions at its discretion. Please refer to Note 11 – Pension Benefits for additional discussion of pension benefits. The Company’s matching contributions to the 401(k) Plan were $5.5 million, $3.9 million, and $4.2 million for the years ended December 31, 2022, 2021, and 2020, respectively.
Note 8 – Fair Value Measurements
The Company follows fair value measurement accounting guidance for all assets and liabilities measured at fair value. This guidance defines fair value as the price that would be received to sell an asset or paid to transfer a liability (an exit price) in an orderly transaction between market participants at the measurement date. Market or observable inputs are the preferred sources of values, followed by assumptions based on hypothetical transactions in the absence of market inputs. The fair value hierarchy for grouping these assets and liabilities is based on the significance level of the following inputs:
•Level 1 – quoted prices in active markets for identical assets or liabilities
•Level 2 – quoted prices in active markets for similar assets or liabilities, quoted prices for identical or similar instruments in markets that are not active, and model-derived valuations whose inputs are observable or whose significant value drivers are observable
•Level 3 – significant inputs to the valuation model are unobservable
The following table is a listing of the Company’s assets and liabilities that are measured at fair value in the accompanying balance sheets and where they are classified within the fair value hierarchy as of December 31, 2022:
| | | | | | | | | | | | | | | | | |
| Level 1 | | Level 2 | | Level 3 |
| (in thousands) |
| Assets: | | | | | |
Derivatives (1) | $ | — | | | $ | 73,142 | | | $ | — | |
| | | | | |
| | | | | |
| | | | | |
| Liabilities: | | | | | |
Derivatives (1) | $ | — | | | $ | 57,323 | | | $ | — | |
____________________________________________
(1) This represents a financial asset or liability that is measured at fair value on a recurring basis.
The following table is a listing of the Company’s assets and liabilities that are measured at fair value in the accompanying balance sheets and where they are classified within the fair value hierarchy as of December 31, 2021:
| | | | | | | | | | | | | | | | | |
| Level 1 | | Level 2 | | Level 3 |
| (in thousands) |
| Assets: | | | | | |
Derivatives (1) | $ | — | | | $ | 24,334 | | | $ | — | |
| Liabilities: | | | | | |
Derivatives (1) | $ | — | | | $ | 345,202 | | | $ | — | |
____________________________________________
(1) This represents a financial asset or liability that is measured at fair value on a recurring basis.
Both financial and non-financial assets and liabilities are categorized within the above fair value hierarchy based on the lowest level of input that is significant to the fair value measurement. The following is a description of the valuation methodologies used by the Company as well as the general classification of such instruments pursuant to the above fair value hierarchy. Please refer to Note 1 – Summary of Significant Accounting Policies for additional information on the Company’s policies for determining fair value for the categories discussed below.
Derivatives
The Company uses Level 2 inputs to measure the fair value of oil, gas, and NGL commodity derivative instruments. Fair values are based upon interpolated data. The Company derives internal valuation estimates taking into consideration forward commodity price curves, counterparties’ credit ratings, the Company’s credit rating, and the time value of money. These valuations are then compared to the respective counterparties’ mark-to-market statements. The considered factors result in an estimated exit price that management believes provides a reasonable and consistent methodology for valuing derivative instruments. The commodity derivative instruments utilized by the Company are not considered by management to be complex, structured, or illiquid. The oil, gas, and NGL commodity derivative markets are highly active.
Generally, market quotes assume that all counterparties have near zero, or low, default rates and have equal credit quality. However, an adjustment may be necessary to reflect the credit quality of a specific counterparty to determine the fair value of the instrument. The Company monitors the credit ratings of its counterparties and may require counterparties to post collateral if their ratings deteriorate. In some instances, the Company will attempt to novate the trade to a more stable counterparty.
Valuation adjustments are necessary to reflect the effect of the Company’s credit quality on the fair value of any commodity derivative liability position. This adjustment takes into account any credit enhancements, such as collateral margin that the Company may have posted with a counterparty, as well as any letters of credit between the parties. The methodology to determine this adjustment is consistent with how the Company evaluates counterparty credit risk, taking into account the Company’s credit rating, current revolving credit facility margins, and any change in such margins since the last measurement date.
The methods described above may result in a fair value estimate that may not be indicative of net realizable value or may not be reflective of future fair values and cash flows. While the Company believes that the valuation methods utilized are appropriate and consistent with authoritative accounting guidance and other marketplace participants, the Company recognizes that third parties may use different methodologies or assumptions to determine the fair value of certain financial instruments that could result in a different estimate of fair value at the reporting date.
Please refer to Note 10 – Derivative Financial Instruments for more information regarding the Company’s derivative instruments.
Oil and Gas Properties and Other Property and Equipment
The Company had no assets included in total property and equipment, net, measured at fair value as of December 31, 2022, or 2021.
The following table presents impairment of proved properties expense and abandonment and impairment of unproved properties expense recorded for the periods presented:
| | | | | | | | | | | | | | | | | |
| For the Years Ended December 31, |
| 2022 | | 2021 | | 2020 |
| (in thousands) |
| Impairment of proved oil and gas properties and related support equipment | $ | — | | | $ | — | | | $ | 956,650 | |
Abandonment and impairment of unproved properties (1) | 7,468 | | | 35,000 | | | 59,363 | |
| Impairment | $ | 7,468 | | | $ | 35,000 | | | $ | 1,016,013 | |
____________________________________________
(1) These impairments related to actual and anticipated lease expirations, as well as actual and anticipated losses on acreage due to title defects, changes in development plans, and other inherent acreage risks. The balances in the unproved oil and gas properties line item on the accompanying balance sheets as of December 31, 2022, and 2021, are recorded at carrying value.
No proved property impairment expense was recorded during the years ended December 31, 2022, or 2021. For the year ended December 31, 2020, the Company recorded impairment expense of $956.7 million related to its South Texas proved oil and gas properties and related support facilities due to the decrease in commodity price forecasts at the end of the first quarter of 2020, specifically decreases in oil and NGL prices. The Company used a discount rate of 11 percent in its calculation of the present value of expected future cash flows based on the prevailing market-based weighted average cost of capital as of March 31, 2020.
Please refer to Note 1 – Summary of Significant Accounting Policies for information on the Company’s policies for determining fair value of its oil and gas producing properties and related impairment expense.
Long-Term Debt
The following table reflects the fair value of the Company’s Senior Notes obligations measured using Level 1 inputs based on quoted secondary market trading prices. These notes were not presented at fair value on the accompanying balance sheets as of December 31, 2022, or 2021, as they were recorded at carrying value, net of any unamortized discounts and deferred financing costs. Please refer to Note 5 – Long-Term Debt for additional information.
| | | | | | | | | | | | | | | | | | | | | | | |
| As of December 31, |
| 2022 | | 2021 |
| Principal Amount | | Fair Value | | Principal Amount | | Fair Value |
| (in thousands) |
10.0% Senior Secured Notes due 2025 | $ | — | | | $ | — | | | $ | 446,675 | | | $ | 491,628 | |
5.0% Senior Notes due 2024 | $ | — | | | $ | — | | | $ | 104,769 | | | $ | 104,583 | |
5.625% Senior Notes due 2025 | $ | 349,118 | | | $ | 337,821 | | | $ | 349,118 | | | $ | 353,091 | |
6.75% Senior Notes due 2026 | $ | 419,235 | | | $ | 409,484 | | | $ | 419,235 | | | $ | 431,787 | |
6.625% Senior Notes due 2027 | $ | 416,791 | | | $ | 402,120 | | | $ | 416,791 | | | $ | 432,783 | |
6.5% Senior Notes due 2028 | $ | 400,000 | | | $ | 384,520 | | | $ | 400,000 | | | $ | 417,284 | |
Note 9 - Earnings Per Share
Basic net income or loss per common share is calculated by dividing net income or loss available to common stockholders by the basic weighted-average number of common shares outstanding for the respective period. Diluted net income or loss per common share is calculated by dividing net income or loss available to common stockholders by the diluted weighted-average number of common shares outstanding, which includes the effect of potentially dilutive securities.
For the years ended December 31, 2022, 2021, and 2020, potentially dilutive securities for this calculation consisted primarily of non-vested RSUs, contingent PSUs, and Warrants, all of which were measured using the treasury stock method. The Warrants became exercisable at the election of the holders on January 15, 2021, and as a result, they were included as potentially dilutive securities on an adjusted weighted-average basis for the portion of the year ended December 31, 2021, for which they were outstanding. A majority of the Warrants were exercised during 2021, and the remaining outstanding Warrants were dilutive during the year ended December 31, 2022, as presented below. The Warrants were not exercisable for the year ended December 31, 2020, and therefore had no dilutive impact. Please refer to Note 3 - Equity for additional detail regarding the terms of the Warrants.
PSUs represent the right to receive, upon settlement of the PSUs after the completion of the three-year performance period, a number of shares of the Company’s common stock that may range from zero to two times the number of PSUs granted on the award date. The number of potentially dilutive shares related to PSUs is based on the number of shares, if any, which would be issuable at the end of the respective reporting period, assuming that date was the end of the contingency period applicable to such PSUs. For additional discussion on PSUs, please refer to Note 7 – Compensation Plans under the heading Performance Share Units.
When the Company recognizes a net loss from continuing operations, all potentially dilutive shares are anti-dilutive and are consequently excluded from the calculation of diluted net loss per common share. The following table details the weighted-average number of anti-dilutive securities for the years presented:
| | | | | | | | | | | | | | | | | |
| For the Years Ended December 31, |
| 2022 | | 2021 | | 2020 |
| (in thousands) |
| Anti-dilutive | — | | | — | | | 265 | |
The following table sets forth the calculations of basic and diluted net income (loss) per common share:
| | | | | | | | | | | | | | | | | |
| For the Years Ended December 31, |
| 2022 | | 2021 | | 2020 |
| (in thousands, except per share data) |
| Net income (loss) | $ | 1,111,952 | | | $ | 36,229 | | | $ | (764,614) | |
| | | | | |
| Basic weighted-average common shares outstanding | 122,351 | | | 119,043 | | | 113,730 | |
| Dilutive effect of non-vested RSUs and contingent PSUs | 1,714 | | | 2,582 | | | — | |
| Dilutive effect of Warrants | 19 | | | 2,065 | | | — | |
| Diluted weighted-average common shares outstanding | 124,084 | | | 123,690 | | | 113,730 | |
| | | | | |
| Basic net income (loss) per common share | $ | 9.09 | | | $ | 0.30 | | | $ | (6.72) | |
| Diluted net income (loss) per common share | $ | 8.96 | | | $ | 0.29 | | | $ | (6.72) | |
Note 10 – Derivative Financial Instruments
Summary of Oil, Gas, and NGL Derivative Contracts in Place
The Company regularly enters into commodity derivative contracts to mitigate a portion of its exposure to oil, gas, and NGL price volatility and location differentials, and the associated impact on cash flows. As of the filing of this report, all contracts were entered into for other-than-trading purposes. The Company’s commodity derivative contracts consist of price swap and collar arrangements for oil, gas, and NGL production. In a typical commodity swap agreement, if the agreed upon published third-party index price (“index price”) is lower than the swap price, the Company receives the difference between the index price and the agreed upon swap price. If the index price is higher than the swap price, the Company pays the difference. For collar arrangements, the Company receives the difference between an agreed upon index price and the floor price if the index price is below the floor price. The Company pays the difference between the agreed upon ceiling price and the index price if the index price is above the ceiling price. No amounts are paid or received if the index price is between the floor and ceiling prices.
The Company has entered into fixed price oil and gas basis swaps in order to mitigate exposure to adverse pricing differentials between certain industry benchmark prices and the actual physical pricing points where the Company’s production is sold. As of December 31, 2022, the Company had basis swap contracts with fixed price differentials between:
•NYMEX WTI and WTI Midland for a portion of its Midland Basin oil production with sales contracts that settle at WTI Midland prices;
•NYMEX WTI and Argus WTI Houston Magellan East Houston Terminal ("MEH”) for a portion of its South Texas oil production with sales contracts that settle at Argus WTI Houston MEH (“WTI Houston MEH”) prices;
•NYMEX HH and Inside FERC West Texas (“IF Waha”) for a portion of its Midland Basin gas production with sales contracts that settle at IF Waha prices; and
•NYMEX HH and Inside FERC Houston Ship Channel (“IF HSC”) for a portion of its South Texas gas production with sales contracts that settle at IF HSC prices.
The Company has also entered into oil swap contracts to fix the differential in pricing between the NYMEX calendar month average and the physical crude oil delivery month (“Roll Differential”) in which the Company pays the periodic variable Roll Differential and receives a weighted-average fixed price differential. The weighted-average fixed price differential represents the amount of net addition (reduction) to delivery month prices for the notional volumes covered by the swap contracts.
As of December 31, 2022, the Company had commodity derivative contracts outstanding through the fourth quarter of 2025 as summarized in the table below:
| | | | | | | | | | | | | | | | | | | | | | | | | | | | | | | | | | | | | | | | | | |
| | Contract Period | | |
| | First Quarter | | Second Quarter | | Third Quarter | | Fourth Quarter | | | | | | | | |
| | 2023 | | 2023 | | 2023 | | 2023 | | 2024 | | 2025 | | | | |
| Oil Derivatives (volumes in MBbl and prices in $ per Bbl): | | | | | | | | | | | | | | |
| Swaps | | | | | | | | | | | | | | | | |
| NYMEX WTI Volumes | | 294 | | | 333 | | | 304 | | | 259 | | | — | | | — | | | | | |
| Weighted-Average Contract Price | | $ | 45.20 | | | $ | 45.18 | | | $ | 45.20 | | | $ | 45.23 | | | $ | — | | | $ | — | | | | | |
ICE Brent Volumes | | 900 | | | 910 | | | 920 | | | 920 | | | 910 | | | — | | | | | |
| Weighted-Average Contract Price | | $ | 86.50 | | | $ | 86.50 | | | $ | 86.50 | | | $ | 86.50 | | | $ | 85.50 | | | $ | — | | | | | |
| Collars | | | | | | | | | | | | | | | | |
| NYMEX WTI Volumes | | 577 | | | 464 | | | 291 | | | — | | | 919 | | | — | | | | | |
| Weighted-Average Floor Price | | $ | 60.00 | | | $ | 67.85 | | | $ | 75.00 | | | $ | — | | | $ | 75.00 | | | $ | — | | | | | |
| Weighted-Average Ceiling Price | | $ | 74.02 | | | $ | 81.53 | | | $ | 93.05 | | | $ | — | | | $ | 81.47 | | | $ | — | | | | | |
| Basis Swaps | | | | | | | | | | | | | | | | |
| WTI Midland-NYMEX WTI Volumes | | 1,294 | | | 1,357 | | | 1,414 | | | 1,294 | | | 893 | | | — | | | | | |
| Weighted-Average Contract Price | | $ | 0.99 | | | $ | 0.99 | | | $ | 0.88 | | | $ | 0.88 | | | $ | 1.10 | | | $ | — | | | | | |
| | | | | | | | | | | | | | | | |
| | | | | | | | | | | | | | | | |
WTI Houston MEH-NYMEX WTI Volumes | | 390 | | | 431 | | | 361 | | | 296 | | | 297 | | | — | | | | | |
| Weighted-Average Contract Price | | $ | 1.65 | | | $ | 1.68 | | | $ | 1.59 | | | $ | 1.53 | | | $ | 1.75 | | | $ | — | | | | | |
| Roll Differential Swaps | | | | | | | | | | | | | | | | |
| NYMEX WTI Volumes | | 1,220 | | | 1,243 | | | 1,304 | | | 1,201 | | | — | | | — | | | | | |
| Weighted-Average Contract Price | | $ | 0.60 | | | $ | 0.62 | | | $ | 0.64 | | | $ | 0.62 | | | $ | — | | | $ | — | | | | | |
| | | | | | | | | | | | | | | | |
| Gas Derivatives (volumes in BBtu and prices in $ per MMBtu): | | | | | | | | | | | | | | |
| Swaps | | | | | | | | | | | | | | | | |
NYMEX HH Volumes | | — | | | 1,420 | | | 1,470 | | | — | | | — | | | — | | | | | |
| Weighted-Average Contract Price | | $ | — | | | $ | 5.05 | | | $ | 5.11 | | | $ | — | | | $ | — | | | $ | — | | | | | |
| | | | | | | | | | | | | | | | |
| | | | | | | | | | | | | | | | |
IF Waha Volumes | | 900 | | | — | | | — | | | — | | | — | | | — | | | | | |
| Weighted-Average Contract Price | | $ | 3.98 | | | $ | — | | | $ | — | | | $ | — | | | $ | — | | | $ | — | | | | | |
| | | | | | | | | | | | | | | | |
| | | | | | | | | | | | | | | | |
| Collars | | | | | | | | | | | | | | | | |
NYMEX HH Volumes | | 7,919 | | | 5,181 | | | 6,194 | | | 8,362 | | | 13,722 | | | — | | | | | |
| Weighted-Average Floor Price | | $ | 3.84 | | | $ | 3.83 | | | $ | 3.75 | | | $ | 3.90 | | | $ | 4.00 | | | $ | — | | | | | |
| Weighted-Average Ceiling Price | | $ | 9.75 | | | $ | 4.68 | | | $ | 4.62 | | | $ | 5.70 | | | $ | 6.39 | | | $ | — | | | | | |
IF HSC Volumes | | 900 | | | 1,345 | | | 1,389 | | | 1,451 | | | — | | | — | | | | | |
| Weighted-Average Floor Price | | $ | 3.38 | | | $ | 4.25 | | | $ | 4.25 | | | $ | 4.25 | | | $ | — | | | $ | — | | | | | |
| Weighted-Average Ceiling Price | | $ | 7.75 | | | $ | 5.00 | | | $ | 4.95 | | | $ | 5.55 | | | $ | — | | | $ | — | | | | | |
| Basis Swaps | | | | | | | | | | | | | | | | |
| | | | | | | | | | | | | | | | |
| | | | | | | | | | | | | | | | |
IF Waha-NYMEX HH Volumes | | 1,816 | | | 2,462 | | | 2,442 | | | 2,337 | | | 20,958 | | | 20,501 | | | | | |
| Weighted-Average Contract Price | | $ | (0.81) | | | $ | (1.93) | | | $ | (1.05) | | | $ | (1.01) | | | $ | (0.86) | | | $ | (0.66) | | | | | |
IF HSC-NYMEX HH Volumes | | 6,737 | | | 1,774 | | | 1,813 | | | 2,008 | | | — | | | — | | | | | |
| Weighted-Average Contract Price | | $ | 0.19 | | | $ | (0.25) | | | $ | (0.25) | | | $ | (0.25) | | | $ | — | | | $ | — | | | | | |
| | | | | | | | | | | | | | | | |
| | | | | | | | | | | | | | | | |
| | | | | | | | | | | | | | | | |
| | | | | | | | | | | | | | | | |
| | | | | | | | | | | | | | | | |
| | | | | | | | | | | | | | | | |
| | | | | | | | | | | | | | | | |
| | | | | | | | | | | | | | | | |
| | | | | | | | | | | | | | | | |
| | | | | | | | | | | | | | | | |
| | | | | | | | | | | | | | | | |
Commodity Derivative Contracts Entered Into Subsequent to December 31, 2022
Subsequent to December 31, 2022, and through the filing of this report, the Company entered into the following commodity derivative contracts:
•NYMEX WTI price swap contracts for the third and fourth quarters of 2023 for a total of 0.6 MMBbl of oil production at a weighted-average contract price of $73.89 per Bbl;
•WTI Midland-NYMEX WTI basis swap contracts for 2024 for a total of 2.1 MMBbl of oil production at a weighted-average contract price of $1.20 per Bbl;
•WTI Houston MEH-NYMEX WTI basis swap contract for 2024 for a total of 0.6 MMBbl of oil production at a contract price of $1.90 per Bbl;
•NYMEX WTI Roll Differential swap contracts for 2024 for a total of 2.2 MMBbl of oil production at a weighted-average contract price of $0.42 per Bbl;
•NYMEX HH collar contracts for 2024 for a total of 5,735 BBtu of gas production at a weighted-average floor contract price of $3.00 per MMBtu and a weighted-average ceiling contract price of $4.70 per MMBtu; and
•OPIS Propane Mont Belvieu Non-TET swap contract for the second through fourth quarters of 2023 for a total of 0.4 MMBbl of NGL production at a contract price of $36.12 per Bbl.
Derivative Assets and Liabilities Fair Value
The Company’s commodity derivatives are measured at fair value and are included in the accompanying balance sheets as derivative assets and liabilities, with the exception of derivative instruments that meet the “normal purchase normal sale” exclusion. The Company does not designate its commodity derivative contracts as hedging instruments. The fair value of the commodity derivative contracts at December 31, 2022, and 2021, was a net asset of $15.8 million and a net liability of $320.9 million, respectively.
The following table details the fair value of commodity derivative contracts recorded in the accompanying balance sheets, by category:
| | | | | | | | | | | |
| As of December 31, 2022 | | As of December 31, 2021 |
| (in thousands) |
| Derivative assets: | | | |
| Current assets | $ | 48,677 | | | $ | 24,095 | |
| Noncurrent assets | 24,465 | | | 239 | |
| Total derivative assets | $ | 73,142 | | | $ | 24,334 | |
| Derivative liabilities: | | | |
| Current liabilities | $ | 56,181 | | | $ | 319,506 | |
| Noncurrent liabilities | 1,142 | | | 25,696 | |
| Total derivative liabilities | $ | 57,323 | | | $ | 345,202 | |
Offsetting of Derivative Assets and Liabilities
As of December 31, 2022, and 2021, all derivative instruments held by the Company were subject to master netting arrangements with various financial institutions. In general, the terms of the Company’s agreements provide for offsetting of amounts payable or receivable between it and the counterparty, at the election of both parties, for transactions that settle on the same date and in the same currency. The Company’s agreements also provide that in the event of an early termination, the counterparties have the right to offset amounts owed or owing under that and any other agreement with the same counterparty. The Company’s accounting policy is to not offset these positions in its accompanying balance sheets.
The following table provides a reconciliation between the gross assets and liabilities reflected on the accompanying balance sheets and the potential effects of master netting arrangements on the fair value of the Company’s commodity derivative contracts:
| | | | | | | | | | | | | | | | | | | | | | | | | | |
| | Derivative Assets as of | | Derivative Liabilities as of |
| | December 31,
2022 | | December 31,
2021 | | December 31,
2022 | | December 31,
2021 |
| | (in thousands) |
Gross amounts presented in the accompanying balance sheets | | $ | 73,142 | | | $ | 24,334 | | | $ | (57,323) | | | $ | (345,202) | |
Amounts not offset in the accompanying balance sheets | | (26,136) | | | (22,862) | | | 26,136 | | | 22,862 | |
| Net amounts | | $ | 47,006 | | | $ | 1,472 | | | $ | (31,187) | | | $ | (322,340) | |
The Company recognizes all gains and losses from changes in commodity derivative fair values immediately in earnings rather than deferring such amounts in accumulated other comprehensive loss. The Company had no commodity derivative contracts designated as hedging instruments for the years ended December 31, 2022, 2021, and 2020. Please refer to Note 8 – Fair Value Measurements for more information regarding the Company’s derivative instruments, including its valuation techniques.
The following table summarizes the commodity components of the derivative settlement (gain) loss, and the net derivative (gain) loss line items presented within the accompanying statements of cash flows and the accompanying statements of operations, respectively:
| | | | | | | | | | | | | | | | | |
| For the Years Ended December 31, |
| 2022 | | 2021 | | 2020 |
| (in thousands) |
| Derivative settlement (gain) loss: | | | | | |
| Oil contracts | $ | 514,641 | | | $ | 523,245 | | | $ | (331,559) | |
| Gas contracts | 171,598 | | | 152,361 | | | (11,898) | |
| NGL contracts | 24,461 | | | 73,352 | | | (7,804) | |
| Total derivative settlement (gain) loss: | $ | 710,700 | | | $ | 748,958 | | | $ | (351,261) | |
| | | | | |
| Net derivative (gain) loss: | | | | | |
| Oil contracts | $ | 284,863 | | | $ | 650,959 | | | $ | (205,180) | |
| Gas contracts | 82,769 | | | 172,248 | | | 30,038 | |
| NGL contracts | 6,380 | | | 78,452 | | | 13,566 | |
| Total net derivative (gain) loss: | $ | 374,012 | | | $ | 901,659 | | | $ | (161,576) | |
Credit Related Contingent Features
As of December 31, 2022, all of the Company’s derivative counterparties were members of the Company’s Credit Agreement lender group. The Company does not enter into derivative contracts with counterparties that are not part of the lender group. Under the Credit Agreement, the Company is required to provide mortgage liens on assets having a value equal to at least 85 percent of the total PV-9, as defined in the Credit Agreement, of the Company’s proved oil and gas properties evaluated in the most recent reserve report. Collateral securing indebtedness under the Credit Agreement also secures the Company’s derivative agreement obligations.
Note 11 – Pension Benefits
The Company has a non-contributory defined benefit pension plan covering employees who meet age and service requirements and who began employment with the Company prior to January 1, 2016 (“Qualified Pension Plan”). The Company also has a supplemental non-contributory pension plan covering certain management employees (“Nonqualified Pension Plan” and together with the Qualified Pension Plan, “Pension Plans”). The Company froze the Pension Plans to new participants, effective January 1, 2016. Employees participating in the Pension Plans prior to the plans being frozen will continue to earn benefits.
Obligations and Funded Status for the Pension Plans
The Company recognizes the funded status (i.e. the difference between the fair value of plan assets and the projected benefit obligation) of the Company’s Pension Plans in the accompanying balance sheets as either an asset or a liability and recognizes a corresponding adjustment within the other comprehensive income (loss), net of tax, line item in the accompanying consolidated
statements of comprehensive income (loss). The projected benefit obligation is the actuarial present value of the benefits earned to date by plan participants based on employee service and compensation including the effect of assumed future salary increases. The accumulated benefit obligation uses the same factors as the projected benefit obligation, but excludes the effects of assumed future salary increases. The Company’s measurement date for plan assets and obligations is December 31.
| | | | | | | | | | | |
| For the Years Ended December 31, |
| 2022 | | 2021 |
| (in thousands) |
| Change in benefit obligation: | | | |
| Projected benefit obligation at beginning of year | $ | 75,760 | | | $ | 73,593 | |
| Service cost | 4,652 | | | 4,455 | |
| Interest cost | 2,314 | | | 2,089 | |
| Actuarial (gain) loss | (15,567) | | | 1,914 | |
| Benefits paid | (1,998) | | | (4,630) | |
| Settlements | — | | | (1,661) | |
| Projected benefit obligation at end of year | 65,161 | | | 75,760 | |
| | | |
| Change in plan assets: | | | |
| Fair value of plan assets at beginning of year | 35,941 | | | 32,894 | |
| Actual return on plan assets | (3,529) | | | 2,777 | |
| Employer contribution | 6,000 | | | 6,561 | |
| Benefits paid | (1,998) | | | (4,630) | |
| Settlements | — | | | (1,661) | |
| Fair value of plan assets at end of year | 36,414 | | | 35,941 | |
| Funded status at end of year | $ | (28,747) | | | $ | (39,819) | |
The Company’s underfunded status for the Pension Plans as of December 31, 2022, and 2021, was $28.7 million and $39.8 million, respectively, and is recognized in the accompanying balance sheets within the other noncurrent liabilities line item. There are no plan assets in the Nonqualified Pension Plan.
Accumulated Benefit Obligation in Excess of Plan Assets for the Pension Plans
| | | | | | | | | | | |
| As of December 31, |
| 2022 | | 2021 |
| (in thousands) |
| Projected benefit obligation | $ | 65,161 | | | $ | 75,760 | |
| | | |
| Accumulated benefit obligation | $ | 55,712 | | | $ | 64,325 | |
| Less: fair value of plan assets | (36,414) | | | (35,941) | |
| Underfunded accumulated benefit obligation | $ | 19,298 | | | $ | 28,384 | |
Pension expense is determined based upon the annual service cost of benefits (the actuarial cost of benefits earned during a period) and the interest cost on those liabilities, less the expected return on plan assets. The expected long-term rate of return on plan assets is applied to a calculated value of plan assets that recognizes changes in fair value over a five-year period. This practice is intended to reduce year-to-year volatility in pension expense, but it can have the effect of delaying recognition of differences between actual returns on assets and expected returns based on long-term rate of return assumptions. Amortization of the unrecognized net gain or loss resulting from actual experience different from that assumed and from changes in assumptions (excluding asset gains and losses not yet reflected in market-related value) is included as a component of net periodic benefit cost for the year. If, as of the beginning of the year, the unrecognized net gain or loss exceeds 10 percent of the greater of the projected benefit obligation and the market-related value of plan assets, then the amortization is the excess divided by the average remaining service period of participating employees expected to receive benefits under the plan.
The pre-tax amounts not yet recognized in net periodic pension costs, but rather recognized in the accumulated other comprehensive loss line item within the accompanying balance sheets as of December 31, 2022, and 2021, were as follows:
| | | | | | | | | | | |
| As of December 31, |
| 2022 | | 2021 |
| (in thousands) |
| Unrecognized actuarial losses | $ | 5,130 | | | $ | 16,388 | |
| | | |
| Accumulated other comprehensive loss (pre-tax) | $ | 5,130 | | | $ | 16,388 | |
The pension liability adjustments recognized in other comprehensive income (loss) during 2022, 2021, and 2020, were as follows:
| | | | | | | | | | | | | | | | | |
| For the Years Ended December 31, |
| 2022 | | 2021 | | 2020 |
| (in thousands) |
| Net actuarial gain (loss) | $ | 10,327 | | | $ | (612) | | | $ | (6,381) | |
| Amortization of prior service cost | — | | | 13 | | | 17 | |
| Amortization of net actuarial loss | 931 | | | 1,240 | | | 950 | |
| Settlements | — | | | 312 | | | 2,509 | |
| Total pension liability adjustment, pre-tax | 11,258 | | | 953 | | | (2,905) | |
| Tax (expense) benefit | (2,431) | | | (204) | | | 626 | |
| Total pension liability adjustment, net | $ | 8,827 | | | $ | 749 | | | $ | (2,279) | |
Components of Net Periodic Benefit Cost for the Pension Plans
| | | | | | | | | | | | | | | | | |
| For the Years Ended December 31, |
| 2022 | | 2021 | | 2020 |
| (in thousands) |
| Components of net periodic benefit cost: | | | | | |
| Service cost | $ | 4,652 | | | $ | 4,455 | | | $ | 4,516 | |
| Interest cost | 2,314 | | | 2,089 | | 2,358 | |
| Expected return on plan assets that reduces periodic pension benefit cost | (1,711) | | | (1,474) | | | (1,735) | |
| Amortization of prior service cost | — | | | 13 | | | 17 | |
| Amortization of net actuarial loss | 931 | | | 1,240 | | | 950 | |
| Net periodic benefit cost | 6,186 | | | 6,323 | | | 6,106 | |
| Settlements | — | | | 312 | | | 2,509 | |
| Total net benefit cost | $ | 6,186 | | | $ | 6,635 | | | $ | 8,615 | |
Pension Plan Assumptions
The weighted-average assumptions used to measure the Company’s projected benefit obligation are as follows:
| | | | | | | | | | | |
| As of December 31, |
| 2022 | | 2021 |
| Projected benefit obligation: | | | |
| Discount rate | 5.2% | | 3.1% |
| Rate of compensation increase | 3.5% | | 3.6% |
The weighted-average assumptions used to measure the Company’s net periodic benefit cost are as follows:
| | | | | | | | | | | | | | | | | |
| For the Years Ended December 31, |
| 2022 | | 2021 | | 2020 |
| Net periodic benefit cost: | | | | | |
| Discount rate | 3.1% | | 2.9% | | 3.6% |
Expected return on plan assets (1) | 3.6% | | 4.4% | | 5.3% |
| Rate of compensation increase | 4.8% | | 4.4% | | 4.5% |
____________________________________________
(1)There is no assumed expected return on plan assets for the Nonqualified Pension Plan because there are no plan assets in the Nonqualified Pension Plan.
The Company’s pension investment policy includes various guidelines and procedures designed to ensure that assets are prudently invested in a manner necessary to meet the future benefit obligation of the Pension Plans. The policy prohibits the direct investment of plan assets in the Company’s securities. The Qualified Pension Plan’s investment horizon is long-term and accordingly the target asset allocations encompass a strategic, long-term perspective of capital markets, expected risk and return behavior and perceived future economic conditions. The key investment principles of diversification, assessment of risk, and targeting the optimal expected returns for given levels of risk are applied.
The Qualified Pension Plan’s investment portfolio contains a diversified blend of investments, which may reflect varying rates of return. The investments are further diversified within each asset classification. This portfolio diversification provides protection against a single security or class of securities having a disproportionate impact on aggregate investment performance. The actual asset allocations are reviewed and rebalanced on a periodic basis to maintain the target allocations.
The weighted-average asset allocation of the Qualified Pension Plan is as follows:
| | | | | | | | | | | | | | | | | | | | |
| | Target | | As of December 31, |
| Asset Category | | 2023 | | 2022 | | 2021 |
| Equity securities | | 45.0 | % | | 47.1 | % | | 39.0 | % |
| Fixed income securities | | 30.0 | % | | 21.0 | % | | 27.9 | % |
| Other securities | | 25.0 | % | | 31.9 | % | | 33.1 | % |
| Total | | 100.0 | % | | 100.0 | % | | 100.0 | % |
There is no asset allocation of the Nonqualified Pension Plan since there are no plan assets in the plan. The assumption of the expected long-term rate of return on plan assets of the Qualified Pension Plan is based upon the target asset allocation and is determined using forward-looking assumptions in the context of historical returns and volatilities for each asset class, as well as correlations among asset classes. The Company evaluates the expected rate of return on plan assets assumption on an annual basis.
Pension Plan Assets
The fair values of the Company’s Qualified Pension Plan assets as of December 31, 2022, and 2021, utilizing the fair value hierarchy discussed in Note 8 – Fair Value Measurements are as follows:
| | | | | | | | | | | | | | | | | | | | | | | | | | | | | |
| | | | | Fair Value Measurements Using: |
| Actual Asset Allocation (1) | | Total | | Level 1 Inputs | | Level 2 Inputs | | Level 3 Inputs |
| | | (in thousands) |
| As of December 31, 2022 | | | | | | | | | |
| Equity securities: | | | | | | | | | |
Domestic (2) | 20.7 | % | | $ | 7,533 | | | $ | 5,012 | | | $ | 2,521 | | | $ | — | |
International (3) | 26.4 | % | | 9,594 | | | 9,594 | | | — | | | — | |
| Total equity securities | 47.1 | % | | 17,127 | | | 14,606 | | | 2,521 | | | — | |
| Fixed income securities: | | | | | | | | | |
Core fixed income (4) | 14.3 | % | | 5,220 | | | 5,220 | | | — | | | — | |
Floating rate corporate loans (5) | 6.7 | % | | 2,450 | | | 2,450 | | | — | | | — | |
| Total fixed income securities | 21.0 | % | | 7,670 | | | 7,670 | | | — | | | — | |
| Other securities: | | | | | | | | | |
Real estate (6) | 6.8 | % | | 2,476 | | | — | | | — | | | 2,476 | |
Collective investment trusts (7) | 1.9 | % | | 687 | | | — | | | 687 | | | — | |
Hedge fund (8) | 23.2 | % | | 8,454 | | | 4,133 | | | — | | | 4,321 | |
| Total other securities | 31.9 | % | | 11,617 | | | 4,133 | | | 687 | | | 6,797 | |
| Total investments | 100.0 | % | | $ | 36,414 | | | $ | 26,409 | | | $ | 3,208 | | | $ | 6,797 | |
| | | | | | | | | |
| As of December 31, 2021 | | | | | | | | | |
| Equity securities: | | | | | | | | | |
Domestic (2) | 19.1 | % | | $ | 6,860 | | | $ | 4,909 | | | $ | 1,951 | | | $ | — | |
International (3) | 19.9 | % | | 7,138 | | | 7,138 | | | — | | | — | |
| Total equity securities | 39.0 | % | | 13,998 | | | 12,047 | | | 1,951 | | | — | |
| Fixed income securities: | | | | | | | | | |
Core fixed income (4) | 18.8 | % | | 6,770 | | | 6,770 | | | — | | | — | |
Floating rate corporate loans (5) | 9.1 | % | | 3,272 | | | 3,272 | | | — | | | — | |
| Total fixed income securities | 27.9 | % | | 10,042 | | | 10,042 | | | — | | | — | |
| Other securities: | | | | | | | | | |
Real estate (6) | 5.1 | % | | 1,833 | | | — | | | — | | | 1,833 | |
Collective investment trusts (7) | 1.4 | % | | 499 | | | — | | | 499 | | | — | |
Hedge fund (8) | 26.6 | % | | 9,569 | | | 5,207 | | | — | | | 4,362 | |
| Total other securities | 33.1 | % | | 11,901 | | | 5,207 | | | 499 | | | 6,195 | |
| Total investments | 100.0 | % | | $ | 35,941 | | | $ | 27,296 | | | $ | 2,450 | | | $ | 6,195 | |
____________________________________________
(1)Percentages may not calculate due to rounding.
(2)Level 1 equity securities consist of United States large and small capitalization companies, which are actively traded securities that can be sold on demand. Level 2 equity securities are investments in a collective investment fund that is valued at net asset value based on the value of the underlying investments and total units outstanding on a daily basis. The objective of these funds is to approximate the S&P 500 by investing in one or more collective investment funds.
(3)International equity securities consist of a well-diversified portfolio of holdings of mostly large issuers organized in developed countries with liquid markets, commingled with investments in equity securities of issuers located in emerging markets that are believed to have strong sustainable financial productivity at attractive valuations.
(4)The objective of core fixed income funds is to achieve value added from sector or issue selection by constructing a portfolio to approximate the investment results of the Barclay’s Capital Aggregate Bond Index with a modest amount of variability in duration around the index.
(5)Investments consist of floating rate bank loans. The interest rates on these loans are typically reset on a periodic basis to account for changes in the level of interest rates.
(6)The investment objective of direct real estate is to provide current income with the potential for long-term capital appreciation. Ownership in real estate entails a long-term time horizon, periodic valuations, and potentially low liquidity.
(7)Collective investment trusts invest in short-term investments and are valued at the net asset value of the collective investment trust. The net asset value, as provided by the trustee, is used as a practical expedient to estimate fair value. The net asset value is based on the fair value of the underlying investments held by the fund less its liabilities.
(8)The hedge fund portfolio includes investments in actively traded global mutual funds that focus on alternative investments and a hedge fund of funds that invests both long and short using a variety of investment strategies.
The following is a summary of the changes in Level 3 plan assets (in thousands):
| | | | | |
| Balance at January 1, 2021 | $ | 5,736 | |
| Purchases | 250 | |
| Realized gain on assets | 132 | |
| Unrealized gain on assets | 298 | |
| Disposition | (221) | |
| Balance at December 31, 2021 | $ | 6,195 | |
| Purchases | 400 | |
| Realized gain on assets | 259 | |
| Unrealized loss on assets | (57) | |
| Disposition | — | |
| Balance at December 31, 2022 | $ | 6,797 | |
Contributions
The Company contributed $6.0 million, $6.6 million, and $6.0 million to the Pension Plans for the years ended December 31, 2022, 2021, and 2020, respectively. The Company expects to make a $10.2 million contribution to the Pension Plans in 2023.
Benefit Payments
The Pension Plans made actual benefit payments of $2.0 million, $6.3 million, and $11.6 million for the years ended December 31, 2022, 2021, and 2020, respectively. Expected benefit payments over the next 10 years are as follows:
| | | | | | | | |
| For the Years Ending December 31, | | Amount |
| | (in thousands) |
| 2023 | | $ | 7,996 | |
| 2024 | | $ | 4,181 | |
| 2025 | | $ | 4,835 | |
| 2026 | | $ | 7,112 | |
| 2027 | | $ | 5,103 | |
| 2028 through 2032 | | $ | 26,981 | |
Note 12 - Leases
As of December 31, 2022, and 2021, the Company had operating leases for asset classes that include office space, office equipment, drilling rigs, midstream agreements, vehicles, and equipment rentals used in field operations. For operating leases recorded on the accompanying balance sheets, remaining lease terms range from less than one year to approximately 10 years. Certain leases contain optional extension periods that allow for terms to be extended for up to an additional 10 years, however in order to maintain financial and operational flexibility, there are no available options to extend that the Company is reasonably certain it will exercise. An early termination option exists for certain leases, some of which allow the Company to terminate a lease within one year, however, there are no leases in which material early termination options are reasonably certain to be exercised by the Company. As of December 31, 2022, and 2021, the Company did not have any agreements in place that were classified as finance leases under Topic 842. As of December 31, 2022, and through the filing of this report, the Company has no material lease arrangements which are scheduled to commence in the future. Please refer to Note 1 – Summary of Significant Accounting Policies for additional information on the Company’s policies for lease determination and classification.
The following table reflects the components of the Company’s total costs, whether capitalized or expensed, related to operating leases, including short-term leases, and variable lease payments made for leases with initial lease terms greater than 12 months, for the years ended December 31, 2022, and 2021. This total does not reflect amounts that may be reimbursed by other third parties in the normal course of business, such as non-operating working interest owners.
| | | | | | | | | | | |
| For the Years Ended December 31, |
| 2022 | | 2021 |
| (in thousands) |
| Operating lease cost | $ | 10,174 | | | $ | 12,825 | |
Short-term lease cost (1) | 175,098 | | | 145,052 | |
Variable lease cost (2) | 7,085 | | | 48,931 | |
| Total lease cost | $ | 192,357 | | | $ | 206,808 | |
____________________________________________
(1) Costs associated with short-term lease agreements relate primarily to operational activities where underlying lease terms are less than one year. This amount includes drilling and completion activities and field equipment rentals, most of which are contracted for 12 months or less. It is expected that this amount will fluctuate primarily with the number of drilling rigs and completion crews the Company is operating under short-term agreements.
(2) Variable lease payments include additional payments made that were not included in the initial measurement of the ROU asset and corresponding liability for lease agreements with terms longer than 12 months. Variable lease payments relate to the actual volumes transported under certain midstream agreements, actual usage associated with drilling rigs, completion crews, and vehicles, and variable utility costs associated with the Company’s leased office space. Fluctuations in variable lease payments are driven by actual volumes delivered and the number of drilling rigs and completion crews operating under long-term agreements.
Cash paid for amounts included in the measurement of lease liabilities for the years ended December 31, 2022, and 2021, were as follows:
| | | | | | | | | | | |
| For the Years Ended December 31, |
| 2022 | | 2021 |
| (in thousands) |
| Operating cash flows from operating leases | $ | 4,718 | | | $ | 11,286 | |
| Investing cash flows from operating leases | $ | 5,042 | | | $ | 2,316 | |
Maturities for the Company’s operating lease liabilities included on the accompanying balance sheets as of December 31, 2022, were as follows:
| | | | | | | | |
| | As of December 31, 2022 |
| | (in thousands) |
| 2023 | | $ | 11,164 | |
| 2024 | | 8,520 | |
| 2025 | | 5,808 | |
| 2026 | | 2,931 | |
| 2027 | | 2,008 | |
| Thereafter | | 8,957 | |
| Total Lease payments | | $ | 39,388 | |
Less: Imputed interest (1) | | (5,654) | |
| Total | | $ | 33,734 | |
____________________________________________
(1) The weighted-average discount rate used to determine the operating lease liability as of December 31, 2022, was 5.8 percent.
The following table presents supplemental accompanying balance sheet information for operating leases as of December 31, 2022, and 2021:
| | | | | | | | | | | |
| As of December 31, |
| 2022 | | 2021 |
| (in thousands, except discount rate and lease term) |
| Balance sheet classifications of operating leases: | | | |
| Other noncurrent assets | $ | 26,368 | | | $ | 19,026 | |
| Other current liabilities | $ | 10,114 | | | $ | 6,516 | |
| Other noncurrent liabilities | $ | 23,621 | | | $ | 19,440 | |
| | | |
| ROU assets obtained in exchange for operating lease liabilities | $ | 16,186 | | | $ | 13,018 | |
| Weighted-average discount rate | 5.8% | | 5.4% |
| Weighted-average remaining lease term (years) | 5 | | 7 |
Note 13 – Accounts Receivable and Accounts Payable and Accrued Expenses
The components of accounts receivable are as follows:
| | | | | | | | | | | |
| As of December 31, |
| 2022 | | 2021 |
| (in thousands) |
| Oil, gas, and NGL production revenue | $ | 184,458 | | | $ | 215,630 | |
| Amounts due from joint interest owners | 45,997 | | | 23,782 | |
| | | |
| | | |
| Other | 2,842 | | | 7,789 | |
| Total accounts receivable | $ | 233,297 | | | $ | 247,201 | |
The components of accounts payable and accrued expenses are as follows:
| | | | | | | | | | | |
| As of December 31, |
| 2022 | | 2021 |
| (in thousands) |
| Drilling and lease operating cost accruals | $ | 125,570 | | | $ | 71,012 | |
| Trade accounts payable | 43,898 | | | 25,072 | |
| Revenue and severance tax payable | 182,744 | | | 254,422 | |
| Property taxes | 43,066 | | | 20,250 | |
| Compensation | 35,799 | | | 47,037 | |
| Derivative settlements | 22,745 | | | 57,186 | |
| Interest | 35,992 | | | 60,273 | |
| Dividends payable | 18,290 | | | — | |
| Other | 24,185 | | | 28,054 | |
| Total accounts payable and accrued expenses | $ | 532,289 | | | $ | 563,306 | |
Note 14 – Asset Retirement Obligations
Please refer to Asset Retirement Obligations in Note 1 – Summary of Significant Accounting Policies for a discussion of the initial and subsequent measurements of asset retirement obligation liabilities and the significant assumptions used in the estimates.
The following is a reconciliation of the Company’s total asset retirement obligation liability as of December 31, 2022, and 2021:
| | | | | | | | | | | |
| As of December 31, |
| 2022 | | 2021 |
| (in thousands) |
| Beginning asset retirement obligations | $ | 101,424 | | | $ | 85,325 | |
Liabilities incurred (1) | 2,086 | | | 1,715 | |
Liabilities settled (2) | (6,356) | | | (1,948) | |
Accretion expense | 5,344 | | | 4,159 | |
Revision to estimated cash flows | 12,815 | | | 12,173 | |
Ending asset retirement obligations (3) | $ | 115,313 | | | $ | 101,424 | |
____________________________________________
(1)Reflects liabilities incurred through drilling activities.
(2)Reflects liabilities settled through plugging and abandonment activities and divestitures of properties.
(3)Balances as of December 31, 2022, and 2021, included $7.1 million and $4.1 million, respectively, related to the Company’s current asset retirement obligation liability, which is recorded in the accounts payable and accrued expenses line item on the accompanying balance sheets.
Note 15 – Suspended Well Costs
The following table reflects the net changes in capitalized exploratory well costs during 2022, 2021, and 2020. The table does not include amounts that were capitalized and either subsequently expensed or reclassified to producing well costs in the same year:
| | | | | | | | | | | | | | | | | |
| For the Years Ended December 31, |
| 2022 | | 2021 | | 2020 |
| (in thousands) |
| Beginning balance | $ | 15,576 | | | $ | 5,698 | | | $ | 11,925 | |
| Additions to capitalized exploratory well costs pending the determination of proved reserves | 49,047 | | | 15,576 | | | 3,346 | |
| | | | | |
| Reclassifications based on the determination of proved reserves | (14,721) | | | (5,698) | | | (9,573) | |
Capitalized exploratory well costs charged to expense (1) | (855) | | | — | | | — | |
| Ending balance | $ | 49,047 | | | $ | 15,576 | | | $ | 5,698 | |
____________________________________________
(1)Relates to unsuccessful exploration activity outside of the Company’s core areas of operation.
As of December 31, 2022, there were no exploratory well costs that were capitalized for more than one year.
Supplemental Oil and Gas Information (unaudited)
Costs Incurred
Costs incurred in oil and gas property acquisition, exploration, and development activities, whether capitalized or expensed, are summarized as follows:
| | | | | | | | | | | | | | | | | |
| For the Years Ended December 31, |
| 2022 | | 2021 | | 2020 |
| (in thousands) |
Development costs (1) | $ | 810,520 | | | $ | 583,527 | | | $ | 490,935 | |
| Exploration costs | 147,042 | | | 125,415 | | | 77,911 | |
| Acquisitions | | | | | |
Proved properties | 18 | | | 71 | | | 5,579 | |
Unproved properties (2) | 4,153 | | | 9,036 | | | 10,854 | |
Total, including asset retirement obligations (3)(4) | $ | 961,733 | | | $ | 718,049 | | | $ | 585,279 | |
____________________________________________
(1)Includes facility costs of $30.0 million, $18.2 million, and $27.2 million for the years ended December 31, 2022, 2021, and 2020, respectively.
(2)Includes amounts related to leasing activity and acquiring surface rights outside of acquisitions of proved and unproved properties totaling $4.2 million, $5.8 million, and $8.6 million for the years ended December 31, 2022, 2021, and 2020, respectively.
(3)Includes amounts relating to estimated asset retirement obligations of $15.1 million, $12.8 million, and $(4.7) million for the years ended December 31, 2022, 2021, and 2020, respectively.
(4)Includes capitalized interest of $17.6 million, $15.0 million, and $15.8 million for the years ended December 31, 2022, 2021, and 2020, respectively.
Oil and Gas Reserve Quantities
The reserve estimates presented below were made in accordance with GAAP requirements for disclosures about oil and gas producing activities and SEC rules for oil and gas reporting of reserve estimation and disclosure.
Proved reserves are the estimated quantities of oil, gas, and NGLs which, by analysis of geoscience and engineering data, can be estimated with reasonable certainty to be economically producible from a given date forward, from known reservoirs, and under existing economic conditions, operating methods, and government regulations prior to the time at which contracts providing the right to operate expire, unless evidence indicates that renewal is reasonably certain, regardless of whether deterministic or probabilistic methods are used for the estimation. Existing economic conditions include prices and costs at which economic producibility from a reservoir is to be determined, and the price to be used is the average price during the 12-month period prior to the ending date of the period covered by the report, determined as an unweighted arithmetic average of the first-day-of-the-month price for each month within such period, unless prices are defined by contractual arrangements, excluding escalations based upon future conditions. All of the Company’s estimated proved reserves are located in the United States.
The tables below present a summary of changes in the Company’s estimated proved reserves for each of the years ended December 31, 2022, 2021, and 2020. The Company engaged Ryder Scott to audit internal engineering estimates for at least 80 percent of the Company’s total calculated proved reserve PV-10 for each year presented. The Company emphasizes that reserve estimates are inherently imprecise and that estimates of new discoveries and undeveloped locations are more imprecise than estimates of established producing oil and gas properties. Accordingly, these estimates are expected to change as future information becomes available.
| | | | | | | | | | | | | | | | | | | | | | | |
| For the Year Ended December 31, 2022 |
| Oil | | Gas | | NGLs | | Total |
| (MMBbl) | | (Bcf) | | (MMBbl) | | (MMBOE) |
| Total proved reserves: | | | | | | |
| Beginning of year | 199.5 | | | 1,243.5 | | | 85.2 | | | 492.0 | |
Revisions of previous estimates (1) | 23.7 | | | 248.2 | | | 16.7 | | | 81.7 | |
| Discoveries and extensions | 6.6 | | | 37.2 | | | 3.9 | | | 16.7 | |
| Sales of reserves | — | | | — | | | — | | | — | |
| Purchases of minerals in place | — | | | — | | | — | | | — | |
| Production | (24.0) | | | (125.9) | | | (8.0) | | | (53.0) | |
| End of year | 205.8 | | | 1,402.9 | | | 97.8 | | | 537.4 | |
| | | | | | | |
| Proved developed reserves: | | | | |
| Beginning of year | 110.7 | | | 833.0 | | | 50.7 | | | 300.2 | |
| End of year | 110.4 | | | 902.1 | | | 57.1 | | | 317.8 | |
| Proved undeveloped reserves: | | | | |
| Beginning of year | 88.8 | | | 410.4 | | | 34.5 | | | 191.8 | |
| End of year | 95.4 | | | 500.8 | | | 40.7 | | | 219.6 | |
____________________________________________
Note: Amounts may not calculate due to rounding.
(1) Revisions of previous estimates consist of 103.2 MMBOE of infill reserves, positive price revisions of 9.5 MMBOE, the removal of 19.9 MMBOE of estimated proved undeveloped reserves reclassified to unproved reserves categories as a result of revising certain aspects of the Company’s future development plans, and negative performance revisions of 11.1 MMBOE. Please refer to Areas of Operation in Part I, Items 1 and 2 of this report, and to Oil and Gas Reserve Quantities in Critical Accounting Estimates in Part II, Item 7 of this report for additional information.
| | | | | | | | | | | | | | | | | | | | | | | |
| For the Year Ended December 31, 2021 |
| Oil | | Gas | | NGLs | | Total |
| (MMBbl) | | (Bcf) | | (MMBbl) | | (MMBOE) |
| Total proved reserves: | | | | | | |
| Beginning of year | 172.7 | | | 1,052.0 | | | 56.6 | | | 404.6 | |
Revisions of previous estimates (1)(2) | 35.7 | | | 158.9 | | | 12.2 | | | 74.4 | |
| Discoveries and extensions | 19.3 | | | 141.4 | | | 21.9 | | | 64.7 | |
| Sales of reserves | (0.3) | | | (0.5) | | | (0.1) | | | (0.4) | |
| Purchases of minerals in place | 0.1 | | | 0.1 | | | — | | | 0.1 | |
| Production | (27.9) | | | (108.4) | | | (5.4) | | | (51.4) | |
| End of year | 199.5 | | | 1,243.5 | | | 85.2 | | | 492.0 | |
| | | | | | | |
| Proved developed reserves: | | | | |
| Beginning of year | 89.8 | | | 643.9 | | | 32.1 | | | 229.3 | |
| End of year | 110.7 | | | 833.0 | | | 50.7 | | | 300.2 | |
| Proved undeveloped reserves: | | | | |
| Beginning of year | 82.9 | | | 408.1 | | | 24.4 | | | 175.3 | |
| End of year | 88.8 | | | 410.4 | | | 34.5 | | | 191.8 | |
____________________________________________
Note: Amounts may not calculate due to rounding.
(1) Revisions of previous estimates consist of 74.4 MMBOE of infill reserves, positive price and performance revisions of 37.2 MMBOE and 3.4 MMBOE, respectively, and the removal of 40.6 MMBOE of estimated proved undeveloped reserves reclassified to unproved reserves categories as a result of revising certain aspects of the Company’s future development plans.
(2) Amounts have been adjusted to conform to the current period presentation.
| | | | | | | | | | | | | | | | | | | | | | | |
| For the Year Ended December 31, 2020 |
| Oil | | Gas | | NGLs | | Total |
| (MMBbl) | | (Bcf) | | (MMBbl) | | (MMBOE) |
| Total proved reserves: | | | | | | | |
| Beginning of year | 184.1 | | | 1,223.2 | | | 74.0 | | | 462.0 | |
Revisions of previous estimates (1)(2) | (7.7) | | | (155.5) | | | (21.7) | | | (55.3) | |
| Discoveries and extensions | 19.6 | | | 96.5 | | | 11.5 | | | 47.1 | |
| Sales of reserves | (0.5) | | | (8.9) | | | (1.1) | | | (3.0) | |
| Purchases of minerals in place | 0.2 | | | 0.6 | | | — | | | 0.4 |
| Production | (23.0) | | | (103.9) | | | (6.1) | | | (46.4) | |
| End of year | 172.7 | | | 1,052.0 | | | 56.6 | | | 404.6 | |
| | | | | | | |
| Proved developed reserves: | | | | | | | |
| Beginning of year | 85.0 | | | 712.1 | | | 43.4 | | | 247.0 | |
| End of year | 89.8 | | | 643.9 | | | 32.1 | | | 229.3 | |
| Proved undeveloped reserves: | | | | | | | |
| Beginning of year | 99.1 | | | 511.1 | | | 30.6 | | | 214.9 | |
| End of year | 82.9 | | | 408.1 | | | 24.4 | | | 175.3 | |
____________________________________________
Note: Amounts may not calculate due to rounding.
(1)Revisions of previous estimates consist of the removal of 65.0 MMBOE of certain longer term estimated proved undeveloped reserves, 32.6 MMBOE of negative price revisions resulting from declining commodity prices during 2020, 38.7 MMBOE of infill reserves, and 3.6 MMBOE of positive performance revisions.
(2)Amounts have been adjusted to conform to the current period presentation.
Standardized Measure of Discounted Future Net Cash Flows
The Company computes a standardized measure of discounted future net cash flows and changes therein relating to estimated proved reserves in accordance with authoritative accounting guidance. Future cash inflows and production and development costs are determined by applying prices and costs, including transportation, quality, and basis differentials, to the year-end estimated future reserve quantities. Each property the Company operates is also charged with field-level overhead in the estimated reserve calculation. Estimated future income taxes are computed using the current statutory income tax rates, including consideration for estimated future statutory depletion. The resulting future net cash flows are reduced to present value amounts by applying a 10 percent annual discount factor.
Future operating costs are determined based on estimates of expenditures to be incurred in developing and producing the estimated proved reserves in place at the end of the period using year end costs and assuming continuation of existing economic conditions, plus Company overhead incurred by the central administrative office attributable to operating activities and estimated abandonment costs.
The assumptions used to compute the standardized measure of discounted future net cash flows are those prescribed by the FASB and the SEC. These assumptions do not necessarily reflect the Company’s expectations of actual revenues to be derived from those reserves, nor their present value amount. The limitations inherent in the reserve quantity estimation process, as discussed previously, are equally applicable to the standardized measure of discounted future net cash flows computations since these reserve quantity estimates are the basis for the valuation process. The following prices as adjusted for transportation, quality, and basis differentials were used in the calculation of the standardized measure of discounted future net cash flows:
| | | | | | | | | | | | | | | | | |
| For the Years Ended December 31, |
| 2022 | | 2021 | | 2020 |
| Oil (per Bbl) | $ | 95.02 | | | $ | 66.21 | | | $ | 37.63 | |
| Gas (per Mcf) | $ | 6.39 | | | $ | 4.28 | | | $ | 1.81 | |
| NGLs (per Bbl) | $ | 35.88 | | | $ | 29.31 | | | $ | 14.64 | |
The following summary sets forth the Company’s future net cash flows relating to proved oil, gas, and NGL reserves based on the standardized measure of discounted future net cash flows:
| | | | | | | | | | | | | | | | | |
| As of December 31, |
| 2022 | | 2021 | | 2020 |
| (in thousands) |
| Future cash inflows | $ | 32,024,639 | | | $ | 21,027,406 | | | $ | 9,227,390 | |
| Future production costs | (7,672,906) | | | (5,498,098) | | | (3,429,288) | |
| Future development costs | (2,949,871) | | | (1,591,550) | | | (1,259,395) | |
| Future income taxes | (3,888,342) | | | (2,130,280) | | | — | |
| Future net cash flows | 17,513,520 | | | 11,807,478 | | | 4,538,707 | |
| 10 percent annual discount | (7,551,454) | | | (4,844,871) | | | (1,856,250) | |
Standardized measure of discounted future net cash flows | $ | 9,962,066 | | | $ | 6,962,607 | | | $ | 2,682,457 | |
The principal sources of changes in the standardized measure of discounted future net cash flows were:
| | | | | | | | | | | | | | | | | |
| For the Years Ended December 31, |
| 2022 | | 2021 | | 2020 |
| (in thousands) |
Standardized measure of discounted future net cash flows, beginning of year | $ | 6,962,607 | | | $ | 2,682,457 | | | $ | 4,103,998 | |
| Sales of oil, gas, and NGLs produced, net of production costs | (2,724,994) | | | (2,092,499) | | | (734,971) | |
| Net changes in prices and production costs | 4,428,804 | | | 5,242,783 | | | (2,251,636) | |
Extensions and discoveries, net of related costs (1) | 424,463 | | | 783,215 | | | 271,897 | |
| Sales of reserves in place | — | | | (4,361) | | | (10,755) | |
| Purchase of reserves in place | — | | | 1,565 | | | 2,120 | |
| Previously estimated development costs incurred during the period | 423,527 | | | 426,120 | | | 431,926 | |
| Changes in estimated future development costs | (462,015) | | | (25,355) | | | 215,460 | |
Revisions of previous quantity estimates (1) | 1,327,530 | | | 1,015,539 | | | 38,623 | |
| Accretion of discount | 815,862 | | | 268,246 | | | 436,284 | |
| Net change in income taxes | (996,437) | | | (1,196,013) | | | 258,844 | |
| Changes in timing and other | (237,281) | | | (139,090) | | | (79,333) | |
Standardized measure of discounted future net cash flows, end of year | $ | 9,962,066 | | | $ | 6,962,607 | | | $ | 2,682,457 | |
____________________________________________
(1)Prior periods have been adjusted to conform to the current period presentation.
ITEM 9. CHANGES IN AND DISAGREEMENTS WITH ACCOUNTANTS ON ACCOUNTING AND FINANCIAL DISCLOSURE
None.
ITEM 9A. CONTROLS AND PROCEDURES
Evaluation of Disclosure Controls and Procedures
We maintain a system of disclosure controls and procedures that are designed to reasonably ensure that information required to be disclosed in our SEC reports is recorded, processed, summarized, and reported within the time periods specified in the SEC’s rules and forms, and to reasonably ensure that such information is accumulated and communicated to our management, including our Chief Executive Officer (Principal Executive Officer) and our Chief Financial Officer (Principal Financial Officer), as appropriate, to allow for timely decisions regarding required disclosure.
Our management, including our Chief Executive Officer and our Chief Financial Officer, does not expect that our disclosure controls and procedures (as defined in Rules 13a-15(e) and 15d-15(e) of the Exchange Act) (“Disclosure Controls”) will prevent all errors and all fraud. A control system, no matter how well conceived and operated, can provide only reasonable, not absolute, assurance that the objectives of the control system are met. Further, the design of a control system must reflect the fact that there are resource constraints, and the benefits of controls must be considered relative to their costs. Because of the inherent limitations in all control systems, no evaluation of controls can provide absolute assurance that all control issues and instances of fraud, if any, within our company have been detected. These inherent limitations include the realities that judgments in decision-making can be faulty, and that breakdowns can occur because of simple error or mistake. Additionally, controls can be circumvented by the individual acts of some persons, by collusion of two or more people, or by management override of the control. The design of any system of controls also is based in part upon certain assumptions about the likelihood of future events, and there can be no assurance that any design will succeed in achieving its stated goals under all potential future conditions. Because of the inherent limitations in a cost-effective control system, misstatements due to error or fraud may occur and not be detected. We monitor our Disclosure Controls and make modifications as necessary; our intent in this regard is that the Disclosure Controls will be modified as systems change and conditions warrant.
An evaluation of the effectiveness of the design and operation of our Disclosure Controls was performed as of the end of the period covered by this report. This evaluation was performed under the supervision and with the participation of our management, including our Chief Executive Officer and Chief Financial Officer. Based upon that evaluation, our Chief Executive Officer and Chief Financial Officer concluded that our Disclosure Controls are effective at a reasonable assurance level.
Changes in Internal Control Over Financial Reporting
There have been no changes during the fourth quarter of 2022 that have materially affected, or are reasonably likely to materially affect, our internal control over financial reporting.
Management’s Report on Internal Control over Financial Reporting
Management of the Company is responsible for establishing and maintaining adequate internal control over financial reporting as defined in Rules 13a-15(f) and 15d-15(f) under the Exchange Act. The Company’s internal control over financial reporting is designed to provide reasonable assurance regarding the reliability of financial reporting and the preparation of financial statements for external purposes in accordance with generally accepted accounting principles. The Company’s internal control over financial reporting includes those policies and procedures that:
(i)pertain to the maintenance of records that, in reasonable detail, accurately and fairly reflect the transactions and dispositions of the assets of the Company;
(ii)provide reasonable assurance that transactions are recorded as necessary to permit preparation of financial statements in accordance with generally accepted accounting principles, and that receipts and expenditures of the Company are being made only in accordance with authorizations of management and directors of the Company; and
(iii)provide reasonable assurance regarding prevention or timely detection of unauthorized acquisition, use, or disposition of the Company’s assets that have a material effect on the financial statements.
Because of the inherent limitations, internal controls over financial reporting may not prevent or detect misstatements. Even those systems determined to be effective can provide only reasonable assurance with respect to financial statement preparation and presentation. Also, projections of any evaluation of effectiveness to future periods are subject to the risk that controls may become inadequate because of the changes in conditions, or that the degree of compliance with the policies and procedures may deteriorate.
Management assessed the effectiveness of the Company’s internal control over financial reporting as of December 31, 2022. In making this assessment, management used the criteria set forth by the Committee of Sponsoring Organizations of the Treadway Commission in Internal Control-Integrated Framework (2013 framework).
Based on management’s assessment and those criteria, management concluded that the Company maintained effective internal control over financial reporting as of December 31, 2022.
The Company’s independent registered public accounting firm has issued an attestation report on the Company’s internal control over financial reporting. That report immediately follows this report.
Report of Independent Registered Public Accounting Firm
To the Stockholders and the Board of Directors of SM Energy Company and subsidiaries
Opinion on Internal Control Over Financial Reporting
We have audited SM Energy Company and subsidiaries’ internal control over financial reporting as of December 31, 2022, based on criteria established in Internal Control—Integrated Framework issued by the Committee of Sponsoring Organizations of the Treadway Commission (2013 framework) (the COSO criteria). In our opinion, SM Energy Company and subsidiaries (the Company) maintained, in all material respects, effective internal control over financial reporting as of December 31, 2022, based on the COSO criteria.
We also have audited, in accordance with the standards of the Public Company Accounting Oversight Board (United States) (PCAOB), the consolidated balance sheets of the Company as of December 31, 2022 and 2021, the related consolidated statements of operations, comprehensive income (loss), changes in stockholders’ equity and cash flows for each of the three years in the period ended December 31, 2022, and the related notes and our report dated February 23, 2023 expressed an unqualified opinion thereon.
Basis for Opinion
The Company’s management is responsible for maintaining effective internal control over financial reporting and for its assessment of the effectiveness of internal control over financial reporting included in the accompanying Management’s Report on Internal Control over Financial Reporting. Our responsibility is to express an opinion on the Company’s internal control over financial reporting based on our audit. We are a public accounting firm registered with the PCAOB and are required to be independent with respect to the Company in accordance with the U.S. federal securities laws and the applicable rules and regulations of the Securities and Exchange Commission and the PCAOB.
We conducted our audit in accordance with the standards of the PCAOB. Those standards require that we plan and perform the audit to obtain reasonable assurance about whether effective internal control over financial reporting was maintained in all material respects.
Our audit included obtaining an understanding of internal control over financial reporting, assessing the risk that a material weakness exists, testing and evaluating the design and operating effectiveness of internal control based on the assessed risk, and performing such other procedures as we considered necessary in the circumstances. We believe that our audit provides a reasonable basis for our opinion.
Definition and Limitations of Internal Control Over Financial Reporting
A company’s internal control over financial reporting is a process designed to provide reasonable assurance regarding the reliability of financial reporting and the preparation of financial statements for external purposes in accordance with generally accepted accounting principles. A company’s internal control over financial reporting includes those policies and procedures that (1) pertain to the maintenance of records that, in reasonable detail, accurately and fairly reflect the transactions and dispositions of the assets of the company; (2) provide reasonable assurance that transactions are recorded as necessary to permit preparation of financial statements in accordance with generally accepted accounting principles, and that receipts and expenditures of the company are being made only in accordance with authorizations of management and directors of the company; and (3) provide reasonable assurance regarding prevention or timely detection of unauthorized acquisition, use, or disposition of the company’s assets that could have a material effect on the financial statements.
Because of its inherent limitations, internal control over financial reporting may not prevent or detect misstatements. Also, projections of any evaluation of effectiveness to future periods are subject to the risk that controls may become inadequate because of changes in conditions, or that the degree of compliance with the policies or procedures may deteriorate.
/s/ Ernst & Young LLP
Denver, Colorado
February 23, 2023
ITEM 9B. OTHER INFORMATION
None.
ITEM 9C. DISCLOSURE REGARDING FOREIGN JURISDICTIONS THAT PREVENT INSPECTIONS
These disclosures are not applicable to the Company.
PART III
ITEM 10. DIRECTORS, EXECUTIVE OFFICERS, AND CORPORATE GOVERNANCE
The information required by this Item concerning the Company’s Directors, Executive Officers, and corporate governance is incorporated by reference to the information provided under the captions “Proposal 1 - Election of Directors,” “Information about our Executive Officers,” and “Corporate Governance” in the Company’s Definitive Proxy Statement on Schedule 14A for the 2023 annual meeting of stockholders, to be filed within 120 days from December 31, 2022.
The information required by this Item concerning compliance with Section 16(a) of the Exchange Act is incorporated by reference to the information provided under the caption “Security Ownership of Certain Beneficial Owners and Management” in the Company’s Definitive Proxy Statement on Schedule 14A for the 2023 annual meeting of stockholders, to be filed within 120 days from December 31, 2022.
ITEM 11. EXECUTIVE COMPENSATION
The information required by this Item is incorporated by reference to the information provided under the captions “Executive Compensation Tables” and “Director Compensation” in the Company’s Definitive Proxy Statement on Schedule 14A for the 2023 annual meeting of stockholders, to be filed within 120 days from December 31, 2022.
ITEM 12. SECURITY OWNERSHIP OF CERTAIN BENEFICIAL OWNERS AND MANAGEMENT AND RELATED STOCKHOLDER MATTERS
The information required by this Item concerning security ownership of certain beneficial owners and management is incorporated by reference to the information provided under the caption “Security Ownership of Certain Beneficial Owners and Management” in the Company’s Definitive Proxy Statement on Schedule 14A for the 2023 annual meeting of stockholders, to be filed within 120 days from December 31, 2022.
Securities Authorized for Issuance Under Equity Compensation Plans. The Company has equity compensation plans under which options and shares of the Company’s common stock are authorized for grant or issuance as compensation to eligible employees, consultants, and members of the Board of Directors. The Company’s stockholders have approved these plans. Please refer to Note 7 – Compensation Plans in Part II, Item 8 of this report for further information about the material terms of the Company’s equity
compensation plans. The following table is a summary of the shares of common stock authorized for issuance under equity compensation plans as of December 31, 2022:
| | | | | | | | | | | | | | | | | | | | |
| | (a) | | (b) | | (c) |
| Plan category | | Number of securities to be issued upon exercise of outstanding options, warrants, and rights | | Weighted-average exercise price of outstanding options, warrants, and rights | | Number of securities remaining available for future issuance under equity compensation plans (excluding securities reflected in column (a)) |
Equity compensation plans approved by security holders: | | | | | | |
Equity Incentive Compensation Plan (1) | | | | | | |
Restricted stock units (2) | | 1,383,846 | | | N/A | | |
Performance share units (2)(3) | | 273,717 | | | N/A | | |
| Total for Equity Incentive Compensation Plan | | 1,657,563 | | | $ | — | | | 3,786,016 | |
Employee Stock Purchase Plan (4) | | — | | | — | | | 3,425,107 | |
Equity compensation plans not approved by security holders | | — | | | — | | | — | |
| Total for all plans | | 1,657,563 | | | $ | — | | | 7,211,123 | |
____________________________________________
(1)In May 2006, the stockholders approved the Equity Plan to authorize the issuance of restricted stock, restricted stock units, non-qualified stock options, incentive stock options, stock appreciation rights, performance shares, performance units, and stock-based awards to key employees, consultants, and members of the Board of Directors of the Company or any affiliate of the Company. The Company’s Board of Directors approved amendments to the Equity Plan in 2009, 2010, 2013, 2016, and 2018 and each amended plan was approved by stockholders at the respective annual stockholders’ meetings. The total number of shares of the Company’s common stock underlying awards granted in 2022, 2021, and 2020 under the Equity Plan were 832,257, 726,562, and 1,726,445, respectively.
(2)RSUs and PSUs do not have exercise prices associated with them, but rather a weighted-average per unit fair value, which is presented in order to provide additional information regarding the potential dilutive effect of the awards. The weighted-average grant date per unit fair value for the outstanding RSUs and PSUs was $22.41 and $26.67, respectively. Please refer to Note 7 – Compensation Plans in Part II, Item 8 of this report for additional discussion.
(3)The number of shares of common stock assumes a multiplier of one. The actual final number of shares of common stock to be issued will range from zero to two times the number of PSUs awarded depending on the three-year performance multiplier.
(4)Under the ESPP, eligible employees may purchase shares of the Company’s common stock through payroll deductions of up to 15 percent of their eligible compensation. The purchase price of the common stock is 85 percent of the lower of the trading price of the common stock on either the first or last day of the six-month offering period. The ESPP is intended to qualify under Section 423 of the IRC. The total number of shares of the Company’s common stock issued in 2022, 2021, and 2020 under the ESPP were 113,785, 313,773, and 464,757, respectively.
ITEM 13. CERTAIN RELATIONSHIPS AND RELATED TRANSACTIONS, AND DIRECTOR INDEPENDENCE
The information required by this Item is incorporated by reference to the information provided under the captions “Certain Relationships and Related Transactions” and “Corporate Governance” in the Company’s Definitive Proxy Statement on Schedule 14A for the 2023 annual meeting of stockholders, to be filed within 120 days from December 31, 2022.
ITEM 14. PRINCIPAL ACCOUNTANT FEES AND SERVICES
The information required by this Item is incorporated by reference to the information provided under the captions “Independent Registered Public Accounting Firm” and “Audit Committee Pre-approval Policy and Procedures” in the Company’s Definitive Proxy Statement on Schedule 14A for the 2023 annual meeting of stockholders, to be filed within 120 days from December 31, 2022.
PART IV
ITEM 15. EXHIBITS AND CONSOLIDATED FINANCIAL STATEMENT SCHEDULES
(a)(1) and (a)(2) Consolidated Financial Statements and Financial Statement Schedules:
| | | | | |
Report of Independent Registered Public Accounting Firm (PCAOB ID 42) | |
| Consolidated Balance Sheets | |
| Consolidated Statements of Operations | |
Consolidated Statements of Comprehensive Income (Loss) | |
| Consolidated Statements of Stockholders’ Equity | |
| Consolidated Statements of Cash Flows | |
| Notes to Consolidated Financial Statements | |
All schedules are omitted because the required information is not applicable or is not present in amounts sufficient to require submission of the schedule or because the information required is included in the Consolidated Financial Statements and Notes thereto.
(b) Exhibits. The following exhibits are filed or furnished with or incorporated by reference into this report on Form 10-K:
| | | | | |
Exhibit Number | Description |
| |
| |
| |
| |
| |
| |
| |
| |
| |
| |
| |
| |
| Supplement and Amendment to Deed of Trust, Mortgage, Line of Credit Mortgage, Assignment, Security Agreement, Fixture Filing and Financing Statement for the benefit of Wachovia Bank, National Association, as Administrative Agent, dated effective as of April 14, 2009 (filed as Exhibit 10.3 to the registrant’s Current Report on Form 8-K filed on April 20, 2009, and incorporated herein by reference) |
| |
| | | | | |
| |
| |
| |
| |
| |
| 101.INS | Inline XBRL Instance Document - The instance document does not appear in the Interactive Data File because its XBRL tags are embedded within the Inline XBRL document. |
| 101.SCH* | Inline XBRL Schema Document |
| 101.CAL* | Inline XBRL Calculation Linkbase Document |
| 101.LAB* | Inline XBRL Label Linkbase Document |
| 101.PRE* | Inline XBRL Presentation Linkbase Document |
| 101.DEF* | Inline XBRL Taxonomy Extension Definition Linkbase Document |
| 104 | Cover Page Interactive Data File (formatted as Inline XBRL and contained in Exhibit 101.INS) |
_____________________________________
| | | | | |
| * | Filed with this report. |
| ** | Furnished with this report. |
| *** | Certain portions of this exhibit have been redacted and are subject to a confidential treatment order granted by the Securities and Exchange Commission pursuant to Rule 24b-2 under the Exchange Act. |
| † | Exhibit constitutes a management contract or compensatory plan or agreement. |
| †† | Exhibit constitutes a management contract or compensatory plan or agreement. This document was amended on July 30, 2010 primarily to reflect the change in the name of the registrant from St. Mary Land & Exploration Company to SM Energy Company. There were no material changes to the substantive terms and conditions in this document. |
| + | Exhibit constitutes a management contract or compensatory plan or agreement. This document was amended on November 9, 2010, in order to make technical revisions to ensure compliance with Section 409A of the Internal Revenue Code. There were no material changes to the substantive terms and conditions in this document. |
| |
(c) Financial Statement Schedules. Please refer to Item 15(a) above.
ITEM 16. FORM 10-K SUMMARY
None.
SIGNATURES
Pursuant to the requirements of Section 13 or 15(d) of the Securities Exchange Act of 1934, the registrant has duly caused this report to be signed on its behalf by the undersigned, thereunto duly authorized.
| | | | | | | | | | | |
| | SM ENERGY COMPANY |
| | (Registrant) |
| | | |
| Date: | February 23, 2023 | By: | /s/ HERBERT S. VOGEL |
| | | Herbert S. Vogel |
| | | President and Chief Executive Officer |
| | | (Principal Executive Officer) |
GENERAL POWER OF ATTORNEY
KNOW ALL PERSONS BY THESE PRESENTS, that each person whose signature appears below constitutes and appoints each of Herbert S. Vogel and A. Wade Pursell his or her true and lawful attorney-in-fact and agent with full power of substitution and resubstitution, and each with full power to act alone, for the undersigned and in his or her name, place and stead, in any and all capacities, to sign any amendments to this Annual Report on Form 10-K for the fiscal year ended December 31, 2022, and to file the same, with exhibits thereto and other documents in connection therewith, with the Securities and Exchange Commission, hereby ratifying and confirming all that each of said attorney-in-fact, or his substitute or substitutes, may do or cause to be done by virtue hereof.
Pursuant to the requirements of the Exchange Act, this report has been signed below by the following persons on behalf of the registrant and in the capacities and on the dates indicated.
| | | | | | | | | | | | | | |
| Signature | | Title | | Date |
| | | | |
| /s/ HERBERT S. VOGEL | | President, Chief Executive Officer, and Director | | February 23, 2023 |
| Herbert S. Vogel | | (Principal Executive Officer) | | |
| | | | |
| | | | |
| /s/ A. WADE PURSELL | | Executive Vice President and Chief Financial Officer | | February 23, 2023 |
| A. Wade Pursell | | (Principal Financial Officer) | | |
| | | | |
| | | | |
| /s/ PATRICK A. LYTLE | | Vice President - Chief Accounting Officer and Controller | | February 23, 2023 |
| Patrick A. Lytle | | (Principal Accounting Officer) | | |
| | | | | | | | | | | | | | |
| Signature | | Title | | Date |
| | | | |
| /s/ WILLIAM D. SULLIVAN | | Chairman of the Board of Directors | | February 23, 2023 |
| William D. Sullivan | | | | |
| | | | |
| | | | |
| /s/ CARLA J. BAILO | | Director | | February 23, 2023 |
| Carla J. Bailo | | | | |
| | | | |
| | | | |
| /s/ STEPHEN R. BRAND | | Director | | February 23, 2023 |
| Stephen R. Brand | | | | |
| | | | |
| | | | |
| /s/ RAMIRO G. PERU | | Director | | February 23, 2023 |
| Ramiro G. Peru | | | | |
| | | | |
| | | | |
| /s/ ANITA M. POWERS | | Director | | February 23, 2023 |
| Anita M. Powers | | | | |
| | | | |
| | | | |
| /s/ JULIO M. QUINTANA | | Director | | February 23, 2023 |
| Julio M. Quintana | | | | |
| | | | |
| | | | |
| /s/ ROSE M. ROBESON | | Director | | February 23, 2023 |
| Rose M. Robeson | | | | |