UNITED
STATES
SECURITIES
AND EXCHANGE COMMISSION
Washington,
D.C. 20549
FORM
10-K
þ Annual
Report Pursuant to Section 13 or 15(d) of the Securities Exchange Act of
1934
For the
fiscal year ended December 31, 2009
or
o Transition
Report Pursuant to Section 13 or 15(d) of the Securities Exchange Act of
1934
Commission
file number 001-31539
ST.
MARY LAND & EXPLORATION COMPANY
(Exact
name of registrant as specified in its charter)
|
Delaware
(State
or other jurisdiction
of
incorporation or organization)
|
41-0518430
(I.R.S.
Employer Identification No.)
|
|
1776
Lincoln Street, Suite 700, Denver, Colorado
(Address
of principal executive offices)
|
80203
(Zip
Code)
|
(303)
861-8140
(Registrant’s
telephone number, including area code)
Securities
registered pursuant to Section 12(b) of the Act:
|
Title
of each class
|
Name
of each exchange on which registered
|
|
|
Common
stock, $.01 par value
|
New
York Stock Exchange
|
Securities
registered pursuant to Section 12(g) of the Act: None
Indicate
by check mark if the registrant is a well-known seasoned issuer, as defined in
Rule 405 of the Securities Act. Yes þ No
o
Indicate
by check mark if the registrant is not required to file reports pursuant to
Section 13 or Section 15(d) of the Act. Yes o No
þ
Indicate
by check mark whether the registrant (1) has filed all reports required to be
filed by Section 13 or 15(d) of the Securities Exchange Act of 1934 during the
preceding 12 months (or for such shorter period that the registrant was required
to file such reports), and (2) has been subject to such filing requirements for
the past 90 days. YesþNoo
Indicate
by check mark whether the registrant has submitted electronically and posted on
its corporate Web site, if any, every Interactive Data File required to be
submitted and posted pursuant to Rule 405 of Regulation S-T (§232.405 of this
chapter) during the preceding 12 months (or for such shorter period that the
registrant was required to submit and post such files).
Yeso Noo
Indicate
by check mark if disclosure of delinquent filers pursuant to Item 405 of
Regulation S-K is not contained herein, and will not be contained, to the best
of registrant’s knowledge, in definitive proxy or information statements
incorporated by reference in Part III of this Form 10-K or any amendment to this
Form 10-K.o
Indicate
by check mark whether the registrant is a large accelerated filer, an
accelerated filer, a non-accelerated filer, or a smaller reporting
company. See the definitions of “large accelerated filer,”
“accelerated filer” and “smaller reporting company” in Rule 12b-2 of the
Exchange Act.
|
Large
accelerated filer þ
|
Accelerated
filer o
|
|
Non-accelerated
filer o (Do
not check if a smaller reporting company)
|
Smaller
reporting company o
|
Indicate
by check mark whether the registrant is a shell company (as defined in Rule
12b-2 of the Exchange Act). Yes o No þ
The
aggregate market value of the 62,106,243 shares of voting stock held by
non-affiliates of the registrant, based upon the closing sale price of the
common stock on June 30, 2009, the last business day of the registrant’s most
recently completed second fiscal quarter, for $20.87 per share as reported on
the New York Stock Exchange was $1,296,157,291. Shares of common
stock held by each director and executive officer and by each person who owns 10
percent or more of the outstanding common stock or who is otherwise believed by
the Company to be in a control position have been excluded. This
determination of affiliate status is not necessarily a conclusive determination
for other purposes.
As of
February 16, 2010, the registrant had 62,777,688 shares of common stock
outstanding, which is net of 126,893 treasury shares held by the
Company.
DOCUMENTS
INCORPORATED BY REFERENCE
Certain
information required by Items 10, 11, 12, 13, and 14 of Part III is incorporated
by reference from portions of the registrant’s definitive proxy statement
relating to its 2010 annual meeting of stockholders to be filed within 120 days
after December 31, 2009.
|
TABLE OF CONTENTS
|
||
|
ITEM
|
PAGE
|
|
|
PART
I
|
||
|
ITEMS
1. and 2.
|
BUSINESS
and
PROPERTIES
|
1
|
|
General
|
1
|
|
|
Strategy
|
1
|
|
|
Significant Developments in
2009
|
1
|
|
|
Outlook for
2010
|
4
|
|
|
Assets
|
4
|
|
|
Reserves
|
9
|
|
|
Production
|
13
|
|
|
Productive
Wells
|
14
|
|
|
Drilling
Activity
|
14
|
|
|
Acreage
|
15
|
|
|
Delivery
Commitments
|
15
|
|
|
Major
Customers
|
16
|
|
|
Employees and Office
Space
|
16
|
|
|
Title to
Properties
|
16
|
|
|
Seasonality
|
16
|
|
|
Competition
|
16
|
|
|
Government
Regulations
|
17
|
|
|
Cautionary Information about
Forward-Looking Statements
|
18
|
|
|
Available
Information
|
20
|
|
|
Glossary of Oil and Natural Gas
Terms
|
21
|
|
|
ITEM
1A.
|
RISK
FACTORS
|
26
|
|
ITEM
1B.
|
UNRESOLVED
STAFF
COMMENTS
|
39
|
|
ITEM
3.
|
LEGAL
PROCEEDINGS
|
39
|
|
ITEM
4.
|
SUBMISSION
OF MATTERS TO A VOTE OF SECURITY
HOLDERS
|
39
|
|
ITEM
4A.
|
EXECUTIVE
OFFICERS OF THE
REGISTRANT
|
39
|
|
PART
II
|
||
|
ITEM
5.
|
MARKET
FOR REGISTRANT’S COMMON EQUITY,
RELATED
STOCKHOLDER MATTERS AND ISSUER
PURCHASES
OF EQUITY
SECURITIES
|
43
|
|
ITEM
6.
|
SELECTED
FINANCIAL
DATA
|
48
|
|
ITEM
7.
|
MANAGEMENT’S
DISCUSSION AND ANALYSIS OF
FINANCIAL
CONDITION AND RESULTS OF OPERATIONS
|
50
|
|
Overview of the
Company
|
50
|
|
|
Financial Results of Operations
and Additional Comparative Data
|
58
|
|
|
Comparison of Financial Results
and Trends between
2009 and
2008
|
62
|
|
|
Comparison of Financial Results
and Trends between
2008 and
2007
|
66
|
|
|
Overview of Liquidity and
Capital
Resources
|
68
|
|
|
Critical Accounting Policies
and
Estimates
|
79
|
|
|
Other Liquidity and Capital
Resources
Information
|
82
|
|
|
Accounting
Matters
|
82
|
|
|
Environmental
|
82
|
|
| Climate Change | 83 | |
|
TABLE OF CONTENTS
|
||
|
(Continued)
|
||
|
ITEM
|
PAGE
|
|
|
ITEM
7A.
|
QUANTITATIVE
AND QUALITATIVE DISCLOSURES ABOUT
MARKET
RISK (included with the content of ITEM
7)
|
85
|
|
ITEM
8.
|
FINANCIAL
STATEMENTS AND SUPPLEMENTARY DATA
|
85
|
|
ITEM
9.
|
CHANGES
IN AND DISAGREEMENTS WITH ACCOUNTANTS
ON
ACCOUNTING AND FINANCIAL
DISCLOSURE
|
85
|
|
ITEM
9A.
|
CONTROLS
AND
PROCEDURES
|
85
|
|
ITEM
9B.
|
OTHER
INFORMATION
|
88
|
|
PART
III
|
||
|
ITEM
10.
|
DIRECTORS,
EXECUTIVE OFFICERS AND CORPORATE
GOVERNANCE
|
88
|
|
ITEM
11.
|
EXECUTIVE
COMPENSATION
|
88
|
|
ITEM
12.
|
SECURITY
OWNERSHIP OF CERTAIN BENEFICIAL
OWNERS
AND MANAGEMENT AND RELATED
STOCKHOLDER
MATTERS
|
88
|
|
ITEM
13.
|
CERTAIN
RELATIONSHIPS AND RELATED TRANSACTIONS,
AND
DIRECTOR
INDEPENDENCE
|
88
|
|
ITEM
14.
|
PRINCIPAL
ACCOUNTANT FEES AND
SERVICES
|
89
|
|
PART
IV
|
||
|
ITEM
15.
|
EXHIBITS
AND FINANCIAL STATEMENT SCHEDULES
|
89
|
PART
I
When we
use the terms “St. Mary,” “the Company,” “we,” “us,” or “our,” we are referring
to St. Mary Land & Exploration Company and its subsidiaries, unless the
context otherwise requires. We have included technical terms
important to an understanding of our business under “Glossary of Oil and Natural
Gas Terms.” Throughout this document we make statements that are
classified as “forward-looking.” Please refer to the “Cautionary
Information about Forward-Looking Statements” section of this document for an
explanation of these types of statements.
ITEMS
1. and 2. BUSINESS and PROPERTIES
General
We are an
independent oil and gas company engaged in the exploration, exploitation,
development, acquisition, and production of natural gas and crude oil in North
America. We were founded in 1908 and incorporated in Delaware in
1915. Our initial public offering of common stock took place in
December 1992. The common stock of the Company trades on the New York
Stock Exchange under the ticker “SM.”
Our
principal offices are located at 1776 Lincoln Street, Suite 700, Denver,
Colorado 80203, and our telephone number is (303) 861-8140.
Strategy
Our
mission is to deliver outstanding net asset value per share growth to our
investors via attractive oil and gas investments. Historically, a key
part of meeting the goal of building stockholder value was the successful
execution and integration of niche acquisitions at attractive
costs. Recently we shifted the emphasis of our efforts to focus on
the exploration for and development of onshore resource plays in North
America. This shift was due to the fact that, as we grew, the
universe of potential niche acquisition targets became smaller and less
impactful to our growth. Additionally, we believe that we will be
able to create more long-term value for our stockholders by building an asset
base that allows for more predictable growth in production and reserves and does
not rely solely on acquisitions. Our strategy is based on the
following points:
|
·
|
Acquire
significant leasehold positions in new and emerging resource
plays
|
|
·
|
Leverage
our core competencies in drilling and completions, as well as
acquisitions
|
|
·
|
Exploit
our legacy assets and optimize our asset base through divestitures of
non-core assets when appropriate
|
|
·
|
Maintain
a strong balance sheet while funding the growth of the
enterprise.
|
Significant
Developments in 2009
|
·
|
Broad Economic
Downturn. Beginning in the latter part of 2008 and
continuing into the first half of 2009 the global economy experienced a
significant downturn related primarily to concerns over the U.S. financial
system. The impact of the downturn spread quickly and affected
a wide range of industries. There were two significant
ramifications to the exploration and production industry. The
first was that capital markets were essentially frozen at the beginning of
2009. Equity, debt, and credit markets were shut
down. We were able to weather this initial shock as a result of
our strong liquidity position and relatively limited capital
commitments. The second impact to the industry was that fear of
global recession and the associated negative impact on energy demand
resulted in a significant decline in oil and gas prices. We
significantly scaled back our operating activity in response to these
price decreases. Our hedging program helped moderate the price
fluctuations that we experienced, particularly in the first half of
2009. After the first quarter of 2009, the broader economy
began to stabilize. The public markets for debt and equity
opened up and banks began to be
|
1
|
less
restrictive with credit. We were able to renew our credit
facility in April of 2009. The outlook for commodity prices
also began to improve. The rapid decrease in activity across
the exploration and production industry led many oilfield service
companies to cut their prices to the benefit of ourselves and our peers as
the year progressed. As industry conditions improved throughout
the year, drilling activity increased in many parts of the
country.
|
|
·
|
Advancement of Resource Play
Potential. From late 2007 through 2009, we established
meaningful positions in several new potential resource plays, principally
the Eagle Ford shale, Haynesville shale, and the Marcellus
shale. Over the past year we worked to advance our
understanding of these plays and move them closer to development
mode. The greatest progress was made in our Eagle Ford shale
program in South Texas. We successfully tested seven wells
across our operated acreage position during the second half of
2009. The early results from this program suggest wells at the
southern end of our acreage will produce drier gas while wells drilled
further north will produce higher BTU-content gas and
condensate. We are currently booking only the parallel offsets
to producing wells as proved undeveloped locations. As a
result, meaningful potential exists to grow proved reserves on our
operated acreage because of our planned drilling activity for
2010. On our joint venture acreage in Dimmitt County, Texas, we
believe these wells will produce even higher amounts of condensate and oil
compared to our operated position. In the Haynesville shale
program in the ArkLaTex region, a number of successful wells were drilled
around our acreage position in Shelby and San Augustine counties in East
Texas in 2009. The 3D seismic shoot of our acreage was recently
received, and we have begun our horizontal drilling in the
play. In our Marcellus shale program in north central
Pennsylvania, we drilled and completed our first two horizontal wells
during 2009. Initial indications from the well tests were
encouraging. We are in the process of constructing the
gathering system that will connect these two wells, as well as future
wells, to the sales pipeline.
|
|
·
|
Volatility in Commodity
Prices. Prices in 2009 were generally more stable than
in 2008. However the exploration and production sector still
experienced significant volatility in the prices for crude oil and natural
gas. Our operations and financial condition are significantly
impacted by these prices. The spot price for NYMEX crude oil in
2009 ranged from a high of $81.04 per barrel in October to a low of $33.98
per barrel in February. The average spot price for oil during
the year was $61.99 per barrel. The volatility in crude oil
prices in early 2009 was driven by concern regarding global demand for
oil. A volatile U.S. dollar was also a contributing factor in
crude price volatility as the spot price of oil reacted to the relative
weakening or strengthening of the U.S.
dollar.
|
The spot
price for gas at Henry Hub, a widely used industry measuring point, averaged
$3.94 per MMBtu in 2009, with a high of $6.11 per MMBtu in January and a
low of $1.88 per MMBtu in September. Natural gas prices came
under pressure in 2009 as a result of lower domestic product demand caused by
the weakening economy; and concerns over excess supply of natural gas due to the
high productivity of several emerging shale plays in the U.S. Some of
the regional markets where we sell gas have seen increased downward pressures on
price as a result of high levels of activity in the regions, as well as a lack
of pipeline takeaway capacity or local demand. This was most
pronounced in our Mid-Continent and Rocky Mountain regions. However,
local index differentials, in the areas where we sell gas, narrowed towards
NYMEX Hub prices in late 2009.
|
·
|
Decrease in Year-End Proved
Reserve Estimates. Our estimated proved reserves
decreased 11 percent to 772.2 BCFE at December 31, 2009, from
865.5 BCFE at December 31, 2008. We
added 109.6 BCFE from our drilling program during the year, with our
emerging resource play in the Eagle Ford shale in the Maverick Basin in
South Texas contributing a significant portion of those
additions. Our programs targeting the Woodford shale in eastern
Oklahoma and the Bakken/Three Forks formations in the North Dakota portion
of the Williston Basin also added meaningful additions in
2009. We sold 44.2 BCFE of proved reserves during the year,
with roughly 90 percent of those relating to the divestiture of our
coalbed methane project at Hanging Woman Basin along the border of Montana
and Wyoming. The balance of the divested properties sold in
2009 related to non-strategic assets spread across our
company.
|
2
We had a
net downward revision of 49.6 BCFE that consisted of 61.6 BCFE in downward
engineering revisions and an upward pricing revision of 12.0
BCFE. The largest portion of the performance revision relates to
producing properties in our Wolfberry tight oil program in the Permian Basin in
West Texas. Well performance data collected during 2009 at our
Sweetie Peck and Halff East programs that target the Wolfberry interval indicate
that these assets are underperforming our year-end 2008 decline
forecasts. Accordingly, we removed 37 BCFE from proved reserves in
the Permian region, primarily related to the Wolfberry tight oil
program. We believe a significant portion of these reserves, while
not meeting the criteria to be booked as proved reserves at year-end, are likely
to eventually be produced. We also had a downward performance
revision of approximately 12 BCFE related to certain Cotton Valley assets in our
ArkLaTex region. The pricing methodology used to determine proved
reserves changed in 2009 in accordance with new rules promulgated by the
SEC. Rather than using year-end pricing, companies are now required
to use the 12-month average of the first of month prices for oil and gas to
estimate proved reserves. This change in methodology from 2008
resulted in a higher oil price and a lower gas price in effect for determining
year-end proved reserves for 2009. As a result, we recognized
positive pricing revisions in our oil-weighted Rocky Mountain and Permian
regions that offset the negative price revisions we recognized in the natural
gas weighted Mid-Continent, ArkLaTex, and South Texas & Gulf Coast
regions. Under the previous methodology of using year-end pricing for
the determination of proved reserves, we would have had a four percent increase
in proved reserves to approximately 897 BCFE.
Prior to
and subsequent to year-end, we entered into several transactions to divest
non-strategic properties across our company. Proved reserves
associated with these properties are estimated to be approximately 71 BCFE and
primarily relate to the previously announced Rocky Mountain oil property
divestiture. Part of this divestiture package closed in mid-February
2010 and we expect the balance to close by the end of the first quarter of
2010.
|
·
|
Impairment of Proved
Properties. We recognized pre-tax non-cash impairments
of proved properties in the amount of $174.8 million in 2009 compared with
$302.2 million of proved property impairments in 2008. A
significant decrease in commodity prices, including differentials, during
the first quarter of 2009 caused the majority of the non-cash
impairment. The largest portion of the impairment in 2009 was
$97.3 million related to assets located in the Mid-Continent region which
were significantly impacted by both low natural gas prices and wider than
normal differentials at the end of the first quarter. The
ArkLaTex region was impacted by a $20.4 million impairment related to
downward pricing and engineering revisions. We incurred a $14.0
million impairment of proved properties related to the write-down of
certain assets located in the Gulf of Mexico for which we are
relinquishing our ownership interests to satisfy our abandonment
obligations.
|
|
·
|
Abandonment and Impairment of
Unproved Properties. During the year, we abandoned or
impaired $45.4 million related to unproved properties. The
largest specific components of the 2009 impairment and abandonment related
to the Floyd Shale acreage located in Mississippi and acreage in
Oklahoma. The remaining write-offs were related to acreage
we
believe we will not keep based on our current capital allocation plans or
related to acreage that we do not believe will be
prospective.
|
|
·
|
Divestiture of Non-Strategic
Properties. In 2009 we undertook an effort to sell a
number of non-strategic properties in order to optimize our
portfolio. The objective of these divestitures is to dispose of
properties with limited future drilling potential while generating cash
that can be used in the testing and development of our resource
plays. During 2009 we sold roughly 44.2 BCFE of reserves, the
vast majority of which related to our coalbed methane program in Hanging
Woman Basin. We received $39.9 million in proceeds from
the sales we closed in 2009. Subsequent to year end, we closed
on a portion of our previously disclosed sale of non-strategic oil and gas
properties in the Rocky Mountain region. The Wyoming
sub-package was sold to Legacy Reserves Operating LP. The cash
received at closing was $118.7 million before commission costs. The
final sales price is subject to normal post-closing adjustments and is
expected to be finalized by the end of second quarter of
2010. Additionally, subsequent to year-end, we also entered
into agreements to sell the
|
3
|
remaining
non-core properties from our Rocky Mountain divestiture package in North
Dakota for $137 million to Sequel Energy Partners LP, as well as some
other minor properties for approximately $6 million. We expect
these divestitures to close by the end of the first quarter of
2010. In total, these divestitures represent 71 BCFE of proved
reserves.
|
Outlook
for 2010
The
general economic outlook for the country has improved compared to this time a
year ago. We successfully weathered a rough 2009, and in the process
advanced a number of potential resource plays and improved our financial
condition.
As we
enter 2010, our company is well positioned both financially and
operationally. Early in 2009, we extended the maturity of our
revolving credit facility and subsequently reduced outstanding borrowings on
that facility during the year. As of February 16, 2010, we had $467
million available to us under the revolving credit facility. We have
no debt maturities until 2012. Additionally, we believe that access
to the capital markets has improved significantly since last year and that we
could access capital through the public markets, if necessary. From
an operational standpoint, we believe 2010 has the potential to be very
promising for our company. We will be building upon our successful
testing programs from 2009. We have moved the Eagle Ford shale
program closer to development mode, and it will receive the largest portion of
our capital budget this year. We will also be allocating more capital
toward oil and rich natural gas projects, given their higher returns in the
current environment. Specifically, we will be drilling more Wolfberry
tight oil and Bakken/Three Forks wells in the Permian and Rocky Mountain
regions, respectively. In the Haynesville shale, we have begun our
horizontal drilling program. We continue to monitor service
costs as the recent uptick in industry activity may pressure rates for the
drilling and completion of wells higher than the levels we saw in
2009. We intend to fund these projects with our current year
operating cash flows and proceeds from our previously announced non-core
divestitures.
Assets
As of
December 31, 2009, we had estimated proved reserves of 53.8 MMBbl of oil and
449.5 Bcf of natural gas. The 12-month average prices in effect on
December 31, 2009, used to estimate proved reserves were $61.18 per barrel of
oil and $3.87 per MMBtu of gas, which represent a 37 percent increase and 32
percent decrease, respectively, from prices used to estimate proved reserves as
of December 31, 2008. On an equivalent basis, our proved reserves
were 772.2 BCFE as of December 31, 2009, a decrease of 11 percent from
865.5 BCFE at the end of the prior year. On an equivalent basis, 82
percent of our proved reserves were classified as proved developed as of
year-end. Total proved oil and gas reserves had a PV-10 value of $1.3
billion and a standardized measure value of $1.0 billion including the effect of
income taxes. A reconciliation between these two amounts is shown
under the Reserves section in Part I, Items 1 and 2 of this
report. During 2009 our average daily production was 194.8 MMcf of
gas and 17.3 MBbl of oil, for an
average equivalent production rate of 298.8 MMCFE per day, which was down
slightly compared with 313.1 MMCFE per day for 2008. Adjusting for
production from properties sold as part of our active divestiture efforts over
the last two years, production from retained properties has remained essentially
flat from 285.6 MMCFE per day in 2008 to 284.7 MMCFE per day in
2009.
In 2009 we incurred costs of $419.0 million for drilling and
exploration activities and acquisitions. This was 51 percent lower
than the $857.7 million incurred in 2008. During 2009 we incurred
exploration costs of $154.1 million compared to $92.2 million in
2008. We incurred development costs of $223.1 million in 2009, which
was 62 percent lower than the $587.6 million in 2008. The decrease in
development dollars and increase in exploration dollars reflects our decision to
not invest capital in development projects in a low commodity price environment,
particularly while service costs were declining. Moreover we ramped
up our exploration efforts to accelerate our understanding of our emerging
resource plays, particularly in the Eagle Ford shale, in order to put ourselves
in a positive position once industry conditions improved. In 2009 we
invested a total of $41.7 million on undeveloped leasehold compared to
$83.1 million in 2008. The majority of our 2009 leasing activity
targeted emerging resource plays in our South Texas & Gulf Coast and
Mid-Continent regions. We spent approximately $126.4 million in 2008
on undeveloped leasehold, including leasehold acquired as part of producing
property
4
acquisitions,
targeting the Cotton Valley and Bakken formations in the ArkLaTex and Rocky
Mountain regions, respectively. In 2009, we did not make any
meaningful acquisitions.
Our
operations are currently concentrated in five core operating areas in the United
States. The following table summarizes the production, proved
reserves, and PV-10 value of our core operating areas as of
December 31, 2009.
|
ArkLaTex
|
Mid-
Continent
|
South
Texas & Gulf Coast
|
Permian
|
Rocky
Mountain
|
Total(1)
(2)
|
|||||||||||||
|
2009
Proved Reserves
|
||||||||||||||||||
|
Oil
(MMBbl)
|
0.4 | 1.1 | 1.4 | 14.2 | 36.7 | 53.8 | ||||||||||||
|
Gas
(Bcf)
|
117.8 | 216.7 | 44.9 | 30.1 | 40.0 | 449.5 | ||||||||||||
|
Equivalents
(BCFE)
|
120.0 | 223.5 | 53.2 | 115.2 | 260.3 | 772.2 | ||||||||||||
|
Relative
percentage
|
15% | 29% | 7% | 15% | 34% | 100% | ||||||||||||
|
Proved
Developed %
|
65% | 83% | 53% | 83% | 93% | 82% | ||||||||||||
|
PV-10
Values (in millions)
|
||||||||||||||||||
|
Proved
Developed
|
$ | 92.1 | $ | 266.3 | $ | 50.5 | $ | 295.5 | $ | 548.7 | $ | 1,253.1 | ||||||
|
Proved
Undeveloped (3)
|
0.1 | (7.4 | ) | (2.0 | ) | 34.9 | 5.4 | 31.0 | ||||||||||
|
Total
Proved
|
$ | 92.2 | $ | 258.9 | $ | 48.5 | $ | 330.4 | $ | 554.1 | $ | 1,284.1 | ||||||
|
Relative
percentage
|
7% | 20% | 4% | 26% | 43% | 100% | ||||||||||||
|
2009
Production
|
||||||||||||||||||
|
Oil
(MMBbl)
|
0.1 | 0.3 | 0.4 | 1.8 | 3.7 | 6.3 | ||||||||||||
|
Gas
(Bcf)
|
14.2 | 34.4 | 7.2 | 4.1 | 11.2 | 71.1 | ||||||||||||
|
Equivalent
(BCFE)
|
14.9 | 36.0 | 9.7 | 15.2 | 33.3 | 109.1 | ||||||||||||
|
Avg.
Daily Equivalents
(MMCFE/d)
|
40.8 | 98.7 | 26.6 | 41.5 | 91.2 | 298.8 | ||||||||||||
|
Relative
percentage
|
14% | 33% | 9% | 14% | 30% | 100% | ||||||||||||
|
(1)
|
Totals
may not add due to rounding.
|
|
(2)
|
Included
in the total are approximately 71 BCFE related to non-core properties that
we have either divested or entered into agreements to divest subsequent to
December 31, 2009.
|
|
(3)
|
St.
Mary will record proved undeveloped locations with a negative PV-10 value
if we have intent to drill the well provided it generates positive net
undiscounted cash flow and meets our economic criteria based on our
corporate price call.
|
ArkLaTex
Region. St. Mary’s operations in the ArkLaTex region are
managed from our office in Shreveport, Louisiana. The ArkLaTex region
was our first operating office, originating from an acquisition in
1992. For years the activities of this region focused on the Cotton
Valley, James Lime, and Travis Peak formations in the region. In 2008
the Haynesville shale emerged as the leading potential resource play in East
Texas and North Louisiana.
The
ArkLaTex region incurred costs of $65.7 million in 2009 for exploration,
development, and acquisition activities. This amount is 70 percent
lower than the $218.4 million spent in 2008, which included $60.3 million in
acquisitions targeting the Cotton Valley formation in East
Texas. Significantly less money was spent on development and
exploration activity in 2009 compared to 2008. With the emergence of
the Haynesville shale late in 2008 and into 2009, our operating partner activity
targeting the Cotton Valley and James Lime formations declined significantly as
they focused on testing and developing their Haynesville shale
properties. We participated in a number of partner-operated wells
that focused on the Haynesville shale. Additionally, we elected to
defer most of our operated horizontal Haynesville drilling until we could
acquire seismic data that would help mitigate risk for larger parts of our
acreage. Our 2009 operated activity in the ArkLaTex region was
primarily focused on drilling wells that preserve acreage. The
region’s 2009 production decreased 19 percent to 14.9 BCFE as a result of the
lower levels of activity described above. Our 2009 year-end proved
reserves were 120.0 BCFE, which is 29 percent lower than the 2008 year-end
proved reserves of 170.0 BCFE. The decrease in
5
proved
reserves is primarily the result of 14.9 BCFE of production and 48.0 BCFE
of negative pricing and engineering revisions. At year-end 2009 we
have no proved reserves booked for our Haynesville potential related to our
acreage in Shelby and San Augustine Counties in East Texas.
The Elm
Grove Field is the highest value field in the ArkLaTex region at year-end
2009. We own interests in approximately 500 producing wells in the
field and believe many of those wells have future uphole recompletion
potential. Our working interest in the field is as high as 36
percent, although it varies greatly across the field. Generally, our
working interest increases as one moves south in the field. The
primary zones of interest in this field have historically been the Cotton Valley
and Hosston. The vast majority of the value and proved reserves in
this field relate to those zones. Over the past year, our operating
partner has focused its drilling efforts almost exclusively in the Haynesville
shale on acreage in the field where we have no working interest. As a
result, we have very little PV-10 value or proved reserve volumes attributable
to the Haynesville shale at the end of 2009 at Elm Grove field.
Our plans
for 2010 in the ArkLaTex region are based almost entirely on testing and
developing the Haynesville shale on our operated acreage. We have
approximately 41,000 net acres across the region with potential for the
Haynesville shale, of which 31,000 is located in Shelby and San Augustine
Counties in East Texas. Roughly 70 percent of our Haynesville
spending will be operated by us and will be focused on our acreage in these
counties. We plan to drill seven horizontal wells targeting the
Haynesville shale in 2010. We will also participate in a number of
wells with operating partners in both northern Louisiana and East Texas that
target the Haynesville interval. We expect that we will invest a
minimal amount of capital this year on the drilling of James Lime and Cotton
Valley wells, although we will have some leasehold and seismic expenditures
related to those programs in 2010. In recent months, the industry has
begun to test the Bossier shale, which is above the Haynesville
shale. As information emerges about this interval, we could choose to
test this formation in 2010. We believe a large portion of our
acreage position in East Texas is also prospective for the Bossier
shale.
Mid-Continent
Region. St. Mary has been active in the Mid-Continent region
since 1973. Operations for the region are managed by our office in
Tulsa, Oklahoma. We have been active in the Anadarko Basin of western
Oklahoma since our entry into the region. In recent years we have
begun operating in the Arkoma Basin in eastern Oklahoma where the current focus
is on horizontal development of the Woodford shale. The Mid-Continent
region also oversees our Marcellus shale activity in north central
Pennsylvania.
In 2009
we incurred costs of $106.8 million in the Mid-Continent region for exploration,
development, and acquisition activity, which is 34 percent less than the $162.0
million deployed in 2008. Approximately
$97 million was deployed in exploration and development activities in 2009,
with the remainder being spent on leasing activities. The 2009
activity for the region focused on the continued development of our horizontal
Woodford shale program in the Arkoma Basin and included the successful
completion of two pilot programs to test the effect of near simultaneous
fracture stimulation on increased density drilling. In the Anadarko
Basin, we maintained a consistent level of operated activity targeting the Deep
Springer formation throughout the year. We also participated in a
largely non-operated program targeting the stacked washes in western
Oklahoma. Lastly, we drilled and completed our first initial tests in
our Marcellus shale program during the second half of
2009. Mid-Continent production in 2009 was 36.0 BCFE, an increase of
9 percent from the 33.0 BCFE produced in 2008. Proved reserves at the
end of 2009 were 223.5 BCFE, a decrease of five percent from the 234.4 BCFE
report for the prior year. The decrease in proved reserves was due in
large part to the low gas price in effect at year end which resulted in downward
pricing revisions of roughly 17 BCFE for some previously booked proved
reserves. The low gas price also resulted in no new proved
undeveloped reserves being added in the region at December 31,
2009.
The
Centrahoma Field in the Arkoma Basin is the highest value field in the
Mid-Continent region. At year-end, we have nearly 160 producing wells
in the field. Over half of those wells were completed in the Woodford
shale and the majority of those were drilled horizontally. The
Woodford shale is the primary contributor to proved reserve volumes and PV-10
value at the Centrahoma Field. We believe there is additional
drilling potential in the Woodford shale as well as uphole development in the
Cromwell and Wapanucka formations.
6
The
largest operated portion of the Mid-Continent region’s budget for 2010 relates
to our emerging program targeting the Marcellus shale in north central
Pennsylvania. We currently have roughly 42,000 net acres leased or
optioned in the Marcellus shale. Four operated horizontal wells are
planned for the year and we expect to begin drilling late in the second quarter
of 2010. Additionally, we are currently in the process of
constructing a gathering system through a large portion of our acreage position
that will connect the first two wells we drilled in 2009 to sales as well as
service future development. Our Marcellus program for 2010 also
includes amounts for leasehold, facilities, and seismic costs. In the
horizontal Woodford, our program for 2010 is primarily designed to preserve core
acreage. Six operated horizontal wells are currently planned, and we
will participate in a handful of wells that will be operated by
others. In the Anadarko Basin, we have four wells planned in the
successful Deep Springer program our regional team has run for the past several
years. Four operated horizontal wells are planned for the horizontal
Granite Wash play that is emerging in western Oklahoma. Our first
horizontal Granite Wash well in this part of the play commenced drilling in
December of 2009 and is still drilling as of the date of this
report.
South Texas &
Gulf Coast Region. St. Mary’s presence in south Louisiana
dates to the early 1900s when our founders acquired our namesake property in St.
Mary Parish, Louisiana abutting the Gulf of Mexico. These 24,914
acres of fee land yielded $3.6 million of oil and gas royalty revenue in
2009. Our presence expanded along the Gulf Coast as a result of the
acquisition of King Ranch Energy, Inc. in 1999. In 2007, we made two
acquisitions in the Maverick Basin in South Texas that targeted Olmos shallow
gas assets in South Texas and provided an entry into this multi-pay
basin. During 2009, one of the other zones of interest, the Eagle
Ford shale, was successfully tested by St. Mary and a
competitor. Today, the Eagle Ford shale is one of the most promising
shale plays in North America. The focus of our Houston office has
steadily shifted over the last couple of years away from projects along the Gulf
Coast and in the Gulf of Mexico toward programs onshore that allow for multiple
years of drilling inventory.
Our
capital expenditures for exploration, development, and acquisition activity in
the South Texas & Gulf Coast region decreased slightly from $120.9 million
in 2008 to $115.1 million in 2009. Nearly all of the capital deployed
in the South Texas & Gulf Coast region in 2009 targeted formations in south
western Texas, namely the Eagle Ford and Pearsall shales. We worked
early in the year to increase our leasehold position in the
area. Additionally, we continued to participate in a joint venture
that allowed us to earn acreage by carrying a partner through completion in a
series of wells. In mid-2009, we began operating on acreage where we
had very high working interests, in many cases a 100 percent. The
encouraging
results from our earlier tests led to an increase in the number of
wells drilled for 2009. To date, the results on our operated acreage
have been very encouraging. On large parts of our acreage, we have
seen rich-gas and condensate in the production stream which enhances the
economics of these gas wells. We did not make any meaningful
investments in properties along the Gulf Coast or in the Gulf of Mexico during
the year. Our last operated platform in the Gulf of Mexico was
largely remediated and abandoned in 2009 after being damaged by Hurricane Ike in
2008.
Production
for the South Texas & Gulf Coast region in 2009 was 9.7 BCFE, a decrease of
32 percent from the 14.3 BCFE produced in 2008. The largest
contributor to the decline year over year was the result of our sale of our
interest in the Judge Digby Field in southern Louisiana at the end of
2008. Excluding the impact of this divestiture, production declined
approximately one percent year over year. Proved reserves at the end
of 2009 were 53.2 BCFE, an increase of 21 percent from the 43.8 BCFE reported in
the prior year. The increase in proved reserves reflects drilling
additions of 39.0 BCFE related entirely to our program in the Eagle Ford shale
and were offset by downward price revisions related to our Olmos gas
program. On our operated acreage targeting the Eagle Ford shale, we
had seven proved developed wells which were producing at
year-end. This program is at an early stage of its development and
accordingly at December 31, 2009, we are booking only parallel offset locations
to our producing wells as proved undeveloped locations. The result is
a total of 14 proved undeveloped locations being booked as of year-end at a
total of 24.6 BCFE. Our operated Eagle Ford program is the most
significant asset in the South Texas & Gulf Coast region.
Our plans
for 2010 in the South Texas & Gulf Coast region are focused exclusively on
the Eagle Ford shale. As of year-end, we have 250,000 net acres
leased or optioned, which is an increase from our previously reported total of
225,000 net acres. We operate roughly 168,000 of those net acres,
most of which is at 100 percent working interest, with the balance of the
acreage being located on joint venture acreage with an industry
7
partner. We
plan to drill 34 horizontal wells on our operated acreage in
2010. Part of our drilling program will be aimed at further
delineating the play in order to make infrastructure commitments later this
year. We currently are able to market all of our production and
expect to do so in the future by working with midstream partners to ensure we
have adequate takeaway and processing capacity to meet our needs. We
will also be conducting a series of tests to help determine the ultimate spacing
for the reservoir. Our operating partner plans to operate two to
three rigs during 2010 on our joint venture acreage where we have a net working
interest of 25 percent.
Permian Basin
Region. The Permian Basin area covers a significant portion of
western Texas and eastern New Mexico and is one of the major producing basins in
the United States. Our holdings in the Permian Basin began with a
series of property acquisitions in 1996. In December 2006 we made a
major acquisition of oil properties that targeted the Wolfberry tight oil
play. To manage the significant increase in operated properties
associated with the Sweetie Peck acquisition, we opened a regional office in
Midland, Texas in February 2007.
We
incurred costs of $76.5 million in the region in 2009 compared to $163.2 million
in 2008. This decrease in capital investment reflects the significant
slowdown in our drilling activity during the first half of the year in response
to the low oil prices being realized late in 2008 and early in
2009. The majority of this capital was deployed to develop projects
in the Wolfberry tight oil play, which targets the stacked carbonate Wolfcamp
and Spraberry formations found in the basin. We also tested other
exploration concepts in the Permian during the year. Production in
the region increased 9 percent over the prior year, from 13.8 BCFE in 2008 to
15.2 BCFE in 2009. Proved reserves as of the end of 2009 were
115.2 BCFE, which is a decrease of 26 percent from 2008 year-end reserves of
155.9 BCFE. The decrease in our estimate of proved reserves relate to
engineering revisions on proved producing properties in our Wolfberry tight oil
program. Well performance data collected during 2009 from our Sweetie
Peck and Halff East assets which target the Wolfberry indicate that these assets
are underperforming our year-end 2008 decline forecasts. Accordingly,
we have removed 37 BCFE from proved reserves in the Permian region, primarily
related to the Wolfberry tight oil program. We believe that a
significant portion of these reserves, while not meeting the criteria to be
booked as proved reserves at year-end, are likely to eventually be produced.
As of the
end of December 2009, the Sweetie Peck assets in the Permian Basin collectively
were the highest value entity in the region. Sweetie Peck field had
182 producing wells at year-end. We have slightly over 20 proved
undeveloped locations booked at Sweetie Peck at year-end. We also
believe there are a meaningful number of unbooked future drilling locations that
we will be able to pursue in future years.
The
largest drilling program planned for the Permian region in 2010 is in our
Sweetie Peck tight oil assets where we plan to drill 32 operated wells this
year. Most of the development will take place on 80- and 40-acre
spaced locations. Despite the downward Wolfberry engineering
revisions in our proved reserve estimates referred to above, these projects
continue to meet our economic standards for drilling, albeit at lower proved
reserve volumes. We will also continue to work on an exploratory
program that began in 2009 and we plan to conduct a modest drilling program in
2010, primarily using vertical wells.
Rocky Mountain
Region. St. Mary has conducted operations in the Williston
Basin in eastern Montana and western North Dakota since 1991. The
region is managed by our office in Billings, Montana. In recent
years, we have expanded our operations into the Greater Green River, Powder
River, Big Horn, and Wind River basins of Wyoming through a series of
acquisitions. The largest growth in the region came in late 2001 and
early 2003 with significant property acquisitions from Choctaw, Burlington
Resources, and Flying J. In recent years, we have been divesting of
non-core properties in the Rocky Mountain region in an effort to focus our human
and investment capital on the most impactful plays in that region.
We
incurred costs of $51.2 million in 2009 for exploration, development, and
acquisitions in the Rocky Mountain region, compared to $190.3 million in
2008. Our 2009 budget in the Rocky Mountain region reflected the low
oil prices and the wide price differentials we experienced at the end of
2008. For much of 2009, we did not have any operated rigs running in
the region. Our capital investments were primarily focused on the
Bakken and Three Forks formations and were heavily weighted toward the back half
of the year. Proved reserves for the Rocky Mountain region were
260.3 BCFE at year-end compared with 261.4 BCFE as of the end of
2008. The slight decrease in proved reserves is the result of selling
40.3 BCFE of proved reserves in the region during the
8
year,
most of which related to the sale of non-strategic coalbed methane project at
Hanging Woman Basin, offset by net positive price and engineering revisions of
50.0 BCFE. Production in the Rocky Mountain region for 2009 was 33.3
BCFE. Total regional production was down five percent from 34.9
BCFE in 2008. Adjusting for the effect of the divestitures,
production in the region would have declined 1.3 BCFE, or four percent, year
over year.
The Elm
Coulee Field is the highest value field in the region at year-end
2009. The reserves in this field are predominately oil, and the
Bakken is the formation of primary interest. The field is largely
developed with only a handful of remaining drilling locations identified as
proved undeveloped.
The
Bakken and Three Forks formations in the Williston Basin will be our primary
focus in 2010. We plan to drill 17 horizontal wells targeting these
formations in 2010. The majority will be located in our Bear Den
asset program in McKenzie and Williams counties in North Dakota where we have
roughly 16,000 net acres. Additionally, we have built a 70,000 net
acre position with potential for the Bakken and Three Forks in McKenzie,
Williams, and Divide counties that we will test during 2010. We are
currently drilling a test well in Wyoming targeting the Niobrara formation as
part of our ongoing exploration effort. We plan to evaluate our
results, as well as those of nearby competitors, during 2010.
Reserves
In
December 2008, the SEC announced that it had approved revisions designed to
modernize oil and gas reporting requirements. A key revision to the
rules pertains to commodity prices. The economic producibility of
reserves and discounted cash flows are now based on a 12-month average commodity
price as opposed to a year-end price in estimating reserves. The
prices used in the calculation of proved reserve estimates as of
December 31, 2009, were $61.18 per Bbl and $3.87 per MMBTU for oil and
natural gas, respectively. These prices were 37 percent higher and 32
percent lower, respectively, than the
year-end prices used to estimate 2008 proved reserves, and 23 percent and 33
percent lower, respectively, than prices that would have been used the SEC’s
previous methodology. If the SEC’s prior methodology had been used
for year-end 2009 proved reserves, the prices used would have been $79.36 per
Bbl and $5.79 per MMBTU.
Additional
revisions to the SEC rules provide for the use of new technology to estimate
proved reserves. Additionally, the definition of proved oil and gas
reserves has been expanded to include non-traditional resources, which focuses
on the marketable product rather than the method of extraction. In
addition to these regulatory changes, in 2009 we began recording estimates of
proved reserve volumes for properties that we believe are reasonably certain to
generate positive net cash flows on an undiscounted basis, that we have the
intent to drill, and which meet our internal economic criteria for
drilling. Previously, we booked proved reserve volumes if the
properties showed a positive PV-10 value, we had the intent to drill, and the
wells met our economic criteria.
The table
below presents summary information with respect to the estimates of our proved
oil and gas reserves for each of the years in the three-year period ended
December 31, 2009. We engaged Ryder Scott Company, L.P. (“Ryder
Scott”) to review internal engineering estimates for at least 80 percent of the
PV-10 value of our proved reserves in 2009, 2008, and 2007, excluding our
coalbed methane properties. For 2008 and 2007, Netherland, Sewell and
Associates, Inc. (“NSAI”) prepared the reserve information for our coalbed
methane projects at Hanging Woman Basin in the northern Powder River Basin and
St. Mary’s non-operated coalbed methane interest in the Green River
Basin. We divested of all Hanging Woman Basin properties in the
fourth quarter of 2009.
We
emphasize that reserve estimates are inherently imprecise and that estimates of
all new discoveries and undeveloped locations are more imprecise than estimates
of established producing oil and gas properties. Accordingly, these
estimates are expected to change as new information becomes available in the
future. The PV-10 values shown in the following table are not
intended to represent the current market value of the estimated proved oil and
gas reserves owned by St. Mary. Neither prices nor costs have been
escalated. The following table should be read along with the section
entitled “Risk Factors – Risks Related to Our Business – The actual quantities
and present values of our proved oil and natural gas reserves may be less than
we have estimated.” No estimates of our proved reserves have been
filed with or included in reports to any federal authority or agency, other than
the SEC, since the beginning of the last fiscal year.
9
The
ability to replace produced reserves is important to the sustainability of all
exploration and production companies. Our 2009 corporate ratio of
reserves replaced through drilling activity was 100 percent. There
were no material acquisitions made in 2009. Four out of our five
regions did not replace their respective regional production for the
year. The one exception, our South Texas & Gulf Coast region,
replaced 400 percent of its production for 2009 due to the strong results in the
Eagle Ford shale. This metric is calculated using information from
the Oil and Gas Reserve Quantities section of Note 16 – Disclosures about Oil
and Gas Producing Activities of Part IV, Item 15 of this report. The
numerator consists of the sum of discoveries and extensions and infill reserves
in an existing proved field, which is then divided by production. We
believe the concept of reserve replacement as described above, as well as
permutations which may include other captions of the Oil and Gas Reserve
Quantities section of Note 16 – Disclosures about Oil and Gas Producing
Activities of Part IV, Item 15 of this report, are widely understood by those
who make investment decisions related to the oil and gas exploration
business. For additional information about reserve replacement
metrics, see the reserve replacement terms in the Glossary section of this
report.
|
As
of December 31,
|
|||||||||
|
Reserves
data:
|
2009
|
2008
|
2007
|
||||||
|
Proved
developed
|
|||||||||
|
Oil
(MMBbl)
|
48.1 | 47.1 | 68.3 | ||||||
|
Gas
(Bcf)
|
342.0 | 433.2 | 426.6 | ||||||
|
BCFE
|
630.3 | 715.8 | 836.3 | ||||||
|
Proved
undeveloped
|
|||||||||
|
Oil
(MMBbl)
|
5.7 | 4.3 | 10.5 | ||||||
|
Gas
(Bcf)
|
107.5 | 124.2 | 186.9 | ||||||
|
BCFE
|
141.9 | 149.7 | 250.2 | ||||||
|
Total
Proved
|
|||||||||
|
Oil
(MMBbl)
|
53.8 | 51.4 | 78.8 | ||||||
|
Gas
(Bcf)
|
449.5 | 557.4 | 613.5 | ||||||
|
BCFE
|
772.2 | 865.5 | 1,086.5 | ||||||
|
Proved
developed reserves %
|
82% | 83% | 77% | ||||||
|
Proved
undeveloped reserves %
|
18% | 17% | 23% | ||||||
|
Reserve
Value info (in thousands)
|
|||||||||
|
Proved
developed PV-10
|
$ | 1,253,056 | $ | 1,214,380 | $ | 3,300,213 | |||
|
Proved
undeveloped PV-10
|
31,029 | 51,005 | 560,974 | ||||||
|
Total
proved PV-10 value
|
$ | 1,284,085 | $ | 1,265,385 | $ | 3,861,187 | |||
|
Standardized
measure of discounted future cash flows
|
1,015,967 | 1,059,069 | 2,706,914 | ||||||
|
Reserve
replacement – drilling and acquisitions, excluding
revisions
|
100% | 174% | 211% | ||||||
|
All
in – including sales of reserves
|
14% | (93)% | 248% | ||||||
|
All
in – excluding sales of reserves
|
55% | (39)% | 249% | ||||||
|
Reserve
life (years) (1)
|
7.1 | 7.6 | 10.1 | ||||||
|
(1)
|
Reserve
life represents the estimated proved reserves at the dates indicated
divided by actual production for the preceding 12-month
period
|
The
following table reconciles the standardized measure of discounted future net
cash flows (GAAP) to the PV-10 value (Non-GAAP). The difference has
to do with the PV-10 value measure excluding the impact of income
taxes. Please see the definitions of standardized measure of
discounted future net cash flows and PV-10 value in the Glossary.
|
As
of December 31,
|
|||||||||
|
2009
|
2008
|
2007
|
|||||||
|
(In
thousands)
|
|||||||||
|
Standardized
measure of discounted future net cash flows
|
$ | 1,015,967 | $ | 1,059,069 | $ | 2,706,914 | |||
|
Add:
10 percent annual discount, net of income taxes
|
732,997 | 724,840 | 2,321,983 | ||||||
|
Add:
future income taxes
|
515,953 | 419,544 | 2,316,637 | ||||||
|
Undiscounted
future net cash flows
|
$ | 2,264,917 | $ | 2,203,453 | $ | 7,345,534 | |||
|
Less:
10 percent annual discount without tax effect
|
(980,832 | ) | (938,068 | ) | (3,484,347 | ) | |||
|
PV-10
value
|
$ | 1,284,085 | $ | 1,265,385 | $ | 3,861,187 | |||
Proved
Undeveloped Reserves
As of
December 31, 2009, we had 141.9 BCFE of proved undeveloped reserves, which is a
decrease of 7.8 BCFE or five percent compared with 149.7 of proved undeveloped
reserves at December 31, 2008. A negative revision of 19.1
BCFE was due to lower pricing in the gas weighted regions, particularly in the
ArkLaTex region where 16.4 BCFE of mostly Cotton Valley proved undeveloped
reserves became uneconomic using the new 12-month average pricing. We
added 43.6 BCFE of proved undeveloped reserves through our drilling
program, 34.3 BCFE of which were extensions and discoveries, primarily in the
Eagle Ford shale, as well as an additional 9.3 BCFE of infill proved undeveloped
reserves that were mostly concentrated in the Cotton Valley and
Bakken. During the year, 7.0 BCFE were sold in divestitures,
primarily in our Rocky Mountain region. We invested approximately $57
million to convert 18.6 BCFE of proved undeveloped reserves in 2009,
which amounted to approximately $57 million in capital expenditures, mainly in
the Wolfberry properties in the Permian region and the Woodford shale in the
Mid-Continent region. We had a negative revision of 6.7 BCFE due to
downward performance revisions in our Wolfberry properties in the Permian region
and 3.6 BCFE of proved undeveloped reserves were removed as a result of the
five year limitation on the number of years that a proved undeveloped reserve
may remain on the books without being developed. As of
December 31, 2009, we have no material proved undeveloped reserves
that have been on the books in excess of five years. As of
December 31, 2009, estimated future development costs relating to
proved undeveloped reserves are projected to be approximately $49 million, $129
million, and $56 million in 2010, 2011, and 2012, respectively.
11
Alternate
Pricing Scenario
The
following table presents our December 31, 2009, reserves data and PV-10 value
based on prices that would have been used under the SEC’s previous methodology
of estimating reserves using year-end pricing. If the SEC’s prior
methodology had been used for year-end 2009 proved reserves, the prices used
would have been $79.36 per barrel and $5.79 per MMBTU. All cost assumptions
remain the same.
|
As
of December 31, 2009
|
|||
|
Reserves
data:
|
|||
|
Proved
developed
|
|||
|
Oil
(MMBbl)
|
53.0 | ||
|
Gas
(Bcf)
|
382.9 | ||
|
BCFE
|
700.8 | ||
|
Proved
undeveloped
|
|||
|
Oil
(MMBbl)
|
8.8 | ||
|
Gas
(Bcf)
|
143.9 | ||
|
BCFE
|
196.4 | ||
|
Total
Proved
|
|||
|
Oil
(MMBbl)
|
61.8 | ||
|
Gas
(Bcf)
|
526.8 | ||
|
BCFE
|
897.2 | ||
|
Proved
developed reserves
|
78% | ||
|
Proved
undeveloped reserves
|
22% | ||
|
Reserve
Value info (in thousands)
|
|||
|
Proved
developed PV-10
|
$ | 2,207,906 | |
|
Proved
undeveloped PV-10
|
235,805 | ||
|
Total
proved PV-10 value
|
$ | 2,443,711 | |
Internal
Controls Over Reserves Estimate
St.
Mary’s policies regarding internal controls over the recording of reserves is
structured to objectively and accurately estimate our oil and gas reserves
quantities and values in compliance with the SEC’s
regulations. Responsibility for compliance in reserves bookings is
delegated to our reservoir engineering group, which is led by our Vice President
of Engineering and Evaluation.
Technical
reviews are performed throughout the year by regional engineering and geologic
staff who evaluate all available geological and engineering
data. This data in conjunction with economic data and ownership
information is used in making a determination of proved reserve
quantities. The reserve process is overseen by Dennis A. Zubieta,
Vice President - Engineering and Evaluation for St.
Mary. Mr. Zubieta joined St. Mary in June 2000 as a
Corporate Acquisition & Divestiture Engineer, assumed the role of Reservoir
Engineer in February 2003, and was appointed Reservoir Engineering Manager in
August 2005. Mr. Zubieta was employed by Burlington Resources Oil and
Gas Company (formerly known as Meridian Oil, Inc) from June 1988 to May 2000 in
various operations and reservoir engineering capacities. Mr. Zubieta
received a Bachelor of Science degree in Petroleum Engineering from Montana Tech
in May 1988. The regional technical staff does not report directly to
Mr. Zubieta; they report to either regional technical managers or directly to
the regional manager in their respective region. This is intended to
promote objective and independent analysis within the reserves
process.
Third-party
Reserves Audit
An
independent audit is performed by Ryder Scott using their own engineering
assumptions and economic data provided by St. Mary. A minimum of 80
percent of the total calculated proved reserve PV-10 value is audited by Ryder
Scott. In aggregate, the reserve values of the audited properties are
required to be within 10 percent of St. Mary’s valuations on both a
corporate and regional level. Ryder Scott is an independent petroleum
engineering consulting firm that has been providing petroleum consulting
services throughout the world for over seventy years. The technical
person at Ryder Scott primarily responsible for overseeing the reserves audit is
a Senior Vice President and holds a Bachelor of Science degree in Petroleum
Engineering from the University of Missouri at Rolla in 1970 and is a registered
Professional Engineer in the States of Colorado and Utah. He is also
a member of the Society of Petroleum Engineers. The Ryder
Scott report is included as Exhibit 99.1.
In
addition to a third party audit, our reserves are reviewed by senior management
and the Audit Committee of St. Mary’s Board of Directors. Senior
management, which includes the President and Chief Executive Officer, the
Executive Vice President and Chief Operating Officer, and the Executive Vice
President and Chief Financial Officer, is responsible for reviewing and
verifying that the estimate of proved reserves is reasonable, complete, and
accurate. The Audit Committee reviews the final reserves estimate in
conjunction with Ryder Scott’s audit letter. They may also meet with
the key representative from Ryder Scott to discuss their process and
findings.
Production
The
following table summarizes the average volumes and realized prices, including
and excluding the effects of hedging, of oil and gas produced from properties in
which St. Mary held an interest during the periods indicated. Also
presented is a production cost per MCFE summary for the Company.
|
Years
Ended December 31,
|
|||||||||
|
2009
|
2008
|
2007
|
|||||||
|
Net
production
|
|||||||||
|
Oil
(MMBbl)
|
6.3 | 6.6 | 6.9 | ||||||
|
Gas
(Bcf)
|
71.1 | 74.9 | 66.1 | ||||||
|
BCFE
|
109.1 | 114.6 | 107.5 | ||||||
|
Average
net daily production
|
|||||||||
|
Oil
(MBbl)
|
17.3 | 18.1 | 18.9 | ||||||
|
Gas
(MMcf)
|
194.8 | 204.7 | 181.0 | ||||||
|
MMCFE
|
298.8 | 313.1 | 294.5 | ||||||
|
Average
realized sales price, excluding the effects of hedging
|
|||||||||
|
Oil
(per Bbl)
|
$ | 54.40 | $ | 92.99 | $ | 67.56 | |||
|
Gas
(per Mcf)
|
$ | 3.82 | $ | 8.60 | $ | 6.74 | |||
|
Per
MCFE
|
$ | 5.65 | $ | 10.99 | $ | 8.48 | |||
|
Average
realized sales price, including the effects of hedging
|
|||||||||
|
Oil
(per Bbl)
|
$ | 56.74 | $ | 75.59 | $ | 62.60 | |||
|
Gas
(per Mcf)
|
$ | 5.59 | $ | 8.79 | $ | 7.63 | |||
|
Per
MCFE
|
$ | 6.94 | $ | 10.11 | $ | 8.71 | |||
|
Production
costs per MCFE
|
|||||||||
|
Lease
operating expense
|
$ | 1.33 | $ | 1.46 | $ | 1.31 | |||
|
Transportation
expense
|
$ | 0.19 | $ | 0.19 | $ | 0.14 | |||
|
Production
taxes
|
$ | 0.37 | $ | 0.71 | $ | 0.58 | |||
Productive
Wells
As of
December 31, 2009, St. Mary had working interests in 2,046 gross (1,000 net)
productive oil wells and 3,154 gross (1,042 net) productive gas
wells. Productive wells are either producing wells or wells capable
of commercial production although currently shut-in. Multiple
completions in the same wellbore are counted as one well. A well is
categorized under state reporting regulations as an oil well or a gas well based
on the ratio of gas to oil produced when it first commenced production, and such
designation may not be indicative of current production.
Subsequent
to year end, we have closed or plan to close on several divestitures of non-core
properties, primarily in the Rocky Mountain region. Upon closing of
these transactions, we will have divested 425 gross (302 net) productive oil
wells and 305 gross (93 net) productive gas wells.
Drilling
Activity
All of
our drilling activities are conducted on a contract basis with independent
drilling contractors. We do not own any drilling
equipment. The following table sets forth the wells drilled and
recompleted in which St. Mary participated during each of the three years
indicated:
|
Years
Ended December 31,
|
||||||||||||
|
2009
|
2008
|
2007
|
||||||||||
|
Gross
|
Net
|
Gross
|
Net
|
Gross
|
Net
|
|||||||
|
Development:
|
||||||||||||
|
Oil
|
103 | 29.64 | 221 | 81.46 | 164 | 77.91 | ||||||
|
Gas
|
74 | 18.15 | 559 | 205.18 | 518 | 204.62 | ||||||
|
Non-productive
|
3 | 1.29 | 25 | 13.70 | 30 | 13.18 | ||||||
| 180 | 49.08 | 805 | 300.34 | 712 | 295.71 | |||||||
|
Exploratory:
|
||||||||||||
|
Oil
|
2 | 0.42 | 2 | 0.40 | 3 | 1.92 | ||||||
|
Gas
|
18 | 9.05 | 10 | 2.75 | 9 | 4.01 | ||||||
|
Non-productive
|
5 | 2.88 | 1 | 0.76 | 5 | 2.58 | ||||||
| 25 | 12.35 | 13 | 3.91 | 17 | 8.51 | |||||||
|
Farmout
or non-consent
|
3 | - | 7 | - | 1 | - | ||||||
|
Total(1)
|
208 | 61.43 | 825 | 304.25 | 730 | 304.22 | ||||||
|
(1)
|
Does
not include one and two gross wells completed on St. Mary’s fee lands
during 2009 and 2008, respectively, in which we only have royalty
interests.
|
A
productive well is an exploratory, development or extension well that is not a
dry well. A dry well (hole) is an exploratory, development, or
extension well that proves to be incapable of producing either oil or gas in
sufficient quantities to justify completion as an oil or gas well.
As
defined in the rules and regulations of the SEC, an exploratory well is a well
drilled to find a new field or to find a new reservoir in a field previously
found to be productive of oil or gas in another reservoir. A
development well is part of a development project, which is defined as the means
by which petroleum resources are brought to the status of economically
producible. The number of wells drilled refers to the number of wells
completed at any time during the respective year, regardless of when drilling
was initiated. Completion refers to the installation of permanent
equipment for production of oil or gas, or, in the case of a dry well, to
reporting to the appropriate authority that the well has been
abandoned.
In
addition to the wells drilled and completed in 2009 included in the table above,
as of February 16, 2010, St. Mary is currently participating in the
drilling of 25 gross wells, all of which are located in the continental United
States. We operate nine of these wells with the remaining 16 wells being
operated by our partners. On a net basis, we are drilling 7.6 net operated
wells and are participating in 2.0 net non-operated
wells.
With respect to completion activity, there are currently 19 wells in which we
have an interest that are being completed. We operate 13 of those on a
gross basis (10.2 net) and is participating with industry partners in 6 gross
(0.3 net) completion activities. The vast majority, if not all, of these
operations relate to the drilling of wells for primary production.
Acreage
The
following table sets forth the gross and net acres of developed and undeveloped
oil and gas leases, fee properties, mineral servitudes, and lease options held
by St. Mary as of December 31, 2009. Undeveloped acreage includes
leasehold interests that may already have been classified as containing proved
undeveloped reserves.
|
Developed
Acres (1)
|
Undeveloped
Acres (2)
|
Total
|
||||||||||
|
Gross
|
Net
|
Gross
|
Net
|
Gross
|
Net
|
|||||||
|
Arkansas
|
1,394 | 163 | 147 | 60 | 1,541 | 223 | ||||||
|
Colorado
|
- | - | 940 | 614 | 940 | 614 | ||||||
|
Kansas
|
- | - | 2,240 | 560 | 2,240 | 560 | ||||||
|
Louisiana
|
101,516 | 37,483 | 25,120 | 4,905 | 126,636 | 42,388 | ||||||
|
Mississippi
|
2,360 | 429 | 100,963 | 42,265 | 103,323 | 42,694 | ||||||
|
Montana
|
59,806 | 40,389 | 343,612 | 236,463 | 403,418 | 276,852 | ||||||
|
Nevada
|
- | - | 197,945 | 197,945 | 197,945 | 197,945 | ||||||
|
New
Mexico
|
2,507 | 1,815 | 1,240 | 1,022 | 3,747 | 2,837 | ||||||
|
North
Dakota
|
127,497 | 87,654 | 216,779 | 121,214 | 344,276 | 208,868 | ||||||
|
Oklahoma
|
256,577 | 81,184 | 70,483 | 32,917 | 327,060 | 114,101 | ||||||
|
Pennsylvania
|
- | - | 30,462 | 27,440 | 30,462 | 27,440 | ||||||
|
Texas
|
221,795 | 106,072 | 544,683 | 260,955 | 766,478 | 367,027 | ||||||
|
Utah
|
- | - | 2,568 | 561 | 2,568 | 561 | ||||||
|
Wyoming
|
88,761 | 52,814 | 285,700 | 143,183 | 374,461 | 195,997 | ||||||
| 862,213 | 408,003 | 1,822,882 | 1,070,104 | 2,685,095 | 1,478,107 | |||||||
|
Louisiana
Fee Properties
|
10,499 | 10,499 | 14,415 | 14,415 | 24,914 | 24,914 | ||||||
|
Louisiana
Mineral Servitudes
|
7,426 | 4,217 | 4,769 | 4,407 | 12,195 | 8,624 | ||||||
| 17,925 | 14,716 | 19,184 | 18,822 | 37,109 | 33,538 | |||||||
|
Total
(3)
|
880,138 | 422,719 | 1,842,066 | 1,088,926 | 2,722,204 | 1,511,645 | ||||||
|
(1)
|
Developed
acreage is acreage assigned to producing wells for the spacing unit of the
producing formation. Developed acreage of St. Mary’s properties
that include multiple formations with different well spacing requirements
may be considered undeveloped for certain formations, but have only been
included as developed acreage in the presentation
above.
|
|
(2)
|
Undeveloped
acreage is lease acreage on which wells have not been drilled or completed
to a point that would permit the production of commercial quantities of
oil and gas, regardless of whether such acreage contains estimated
reserves.
|
|
(3)
|
Subsequent
to December 31, 2009, St. Mary divested certain non-core properties, which
included leases covering approximately 26,100 and 25,100 developed gross
and net acres, respectively, and 18,600 and 15,000 undeveloped gross and
net acres, respectively. Additionally, we entered into
agreements to divest certain non-core properties, which included leases
covering approximately 80,200 and 44,500 developed gross and net acres,
respectively, and 63,700 and 31,000 undeveloped gross and net acres,
respectively.
|
Delivery
Commitments
As of
December 31, 2009, there were no material delivery
commitments. Subsequent to year end we are subject to a certain
gathering through-put contract that requires a minimum volume delivery of 15 Bcf
by January 1, 2013. We will be required to pay $0.18 Mcf for any
shortfall in delivering the minimum volume of 15 Bcf. At the current
time, the company does not have proved developed reserves to offset
this contractual liability, but fully intends to develop proved undeveloped
reserves that will exceed the through-put commitment.
Major
Customers
During
2009, sales to Teppco Crude Oil LLC individually accounted for 12 percent of our
total oil and gas production revenue. During 2008 and 2007, no
customer individually accounted for ten percent or more of our total oil and gas
production revenue.
Employees
and Office Space
As of
February 16, 2010, we had 550 full-time employees. None of our
employees are subject to a collective bargaining agreement and we consider our
relations with our employees to be good. As of
December 31, 2009, we lease approximately 79,000 square feet of office space in
Denver, Colorado for our executive and administrative offices, of which
approximately 9,000 square feet is subleased. We lease approximately
22,000 square feet of office space in Tulsa, Oklahoma; approximately 22,000
square feet in Shreveport, Louisiana; approximately 26,000 square feet in
Houston, Texas; approximately 17,000 square feet in Midland, Texas;
approximately 36,000 square feet in Billings, Montana; approximately 6,000
square feet in Williston, North Dakota; and approximately 2,000 square feet in
Casper, Wyoming.
Title
to Properties
Substantially
all of our working interests are held pursuant to leases from third
parties. A title opinion is usually obtained prior to the
commencement of drilling operations. We have obtained title opinions
or have conducted a thorough title review on substantially all of our producing
properties and believe that we have satisfactory title to such properties in
accordance with standards generally accepted in the oil and gas
industry. The majority of the value of our properties is subject to a
mortgage under our credit facility, customary royalty interests, liens for
current taxes, and other burdens that we believe do not materially interfere
with the use of or affect the value of such properties. We perform
only a minimal title investigation before acquiring undeveloped
leasehold.
Seasonality
Generally,
but not always, the demand and price levels for natural gas increase during the
colder winter months and decrease during the warmer summer months. To
lessen seasonal demand fluctuations, pipelines, utilities, local distribution
companies, and industrial users utilize natural gas storage facilities and
forward purchase some of their anticipated winter requirements during the
summer. However, increasing summertime demand for electricity is
beginning to place increased demand on storage volumes. Crude oil and
the demand for heating oil are also impacted by generally higher prices in the
winter and the summer driving season – although oil is much more driven by
global supply and demand. Seasonal anomalies such as mild winters
sometimes lessen these fluctuations. The impact of seasonality has
somewhat been exacerbated by the overall supply and demand economics related to
crude oil because there is a narrow margin of production capacity in excess of
existing worldwide demand.
Competition
The oil
and gas industry is intensely competitive, particularly with respect to
capturing prospective oil and natural gas properties and oil and gas
reserves. We believe our leasehold position provides a sound
foundation for a solid drilling program. Our competitive position
also depends on our geological, geophysical, and engineering expertise, and our
financial resources. We believe the location of our leasehold
acreage, our exploration, drilling, and production expertise and available
technologies, and the experience and knowledge of our management and industry
partners enable us to compete effectively in our core operating and resource
play areas. Notwithstanding our talents and assets, we still face
stiff competition from a substantial number of major and independent oil and gas
companies who have larger technical staffs and greater financial and operational
resources than we do. Many of these companies not only engage in the
acquisition, exploration, development, and production of oil and natural gas
reserves, but also have refining operations, market refined products, own
drilling rigs, and generate electricity. We also compete with other
oil and natural gas companies in attempting to secure drilling rigs and other
equipment and services necessary for the drilling and completion of
wells. Consequently, we may face shortages
16
or delays
in securing these services from time to time. We are seeing signs of
tightening rig availability, although it is quite specific by
region. The oil and natural gas industry also faces competition from
alternative fuel sources, including other fossil fuels such as coal and imported
liquefied natural gas. Competitive conditions may be affected by
future legislation and regulations as the U.S. develops new energy and
climate-related policies. Finally, we also compete for
people. Throughout the industry, the need to attract and retain
talented people has grown at a time when the number of people available is
constrained. We are not insulated from this resource constraint, and
we must compete effectively in this market in order to be
successful.
Government
Regulations
Our
business is extensively regulated by numerous federal, state, and local laws and
government regulations. These laws and regulations may be changed
from time to time in response to economic or political conditions, or other
developments, and our regulatory burden may increase in the
future. Laws and regulations increase our cost of doing business and,
consequently, affect our profitability. However, we do not believe
that we are affected to a materially greater or lesser extent than others in our
industry.
Energy
Regulations. Many of the states in which we conduct our
operations have adopted laws and regulations governing the exploration for and
production of crude oil and natural gas, including laws and regulations
requiring permits for the drilling of wells, imposing bonding requirements in
order to drill or operate wells, and governing the location of wells, the method
of drilling and casing wells, the surface use and restoration of properties upon
which wells are drilled, and the plugging and abandonment of
wells. Our operations are also subject to various state conservation
laws and regulations, including regulations governing the size of drilling and
spacing units or proration units, the number of wells which may be drilled in an
area, the spacing of wells, and the unitization or pooling of crude oil and
natural gas properties. In addition, state conservation laws
sometimes establish maximum rates of production from crude oil and natural gas
wells, generally prohibit the venting or flaring of natural gas, and may impose
certain requirements regarding the ratability or fair apportionment of
production from fields and individual wells.
Some of
our operations are conducted on federal lands pursuant to oil and gas leases
administered by the Bureau of Land Management (BLM) or the Minerals Management
Service (MMS). These leases contain relatively standardized terms and
require compliance with detailed regulations and orders, which are subject to
change. In addition to permits required from other regulatory
agencies, lessees must obtain a permit from the BLM or MMS before drilling and
comply with regulations governing, among other things, engineering and
construction specifications for production facilities, safety procedures, the
valuation of production and payment of royalties, the removal of facilities, and
the posting of bonds to ensure that lessee obligations are met. Under
certain circumstances, the BLM or the MMS, as applicable, may require our
operations on federal leases to be suspended or terminated.
In
January 2010, the BLM announced that it will be issuing a new draft oil and gas
leasing policy that will require, among other things, a more detailed
environmental review prior to leasing oil and natural gas resources, increased
public engagement in the development of master leasing and development plans
prior to leasing areas where intensive new oil and gas development is
anticipated, and a comprehensive parcel review process. As the policy
has not yet been released, we are not able to determine the impact these
potential leasing policy changes may have on our business.
Our sales
of natural gas are affected by the availability, terms, and cost of natural gas
pipeline transportation. The Federal Energy Regulatory Commission
(FERC) has jurisdiction over the transportation and sale for resale of natural
gas in interstate commerce. The FERC’s current regulatory framework
generally provides for a competitive and open access market for sales and
transportation of natural gas. However, FERC regulations continue to
affect the midstream and transportation segments of the industry, and thus can
indirectly affect the sales prices we receive for natural gas
production. In addition, the less stringent regulatory approach
recently pursued by the FERC and the U.S. Congress may not continue
indefinitely.
17
Environmental, Health and Safety
Regulations. Our operations are subject to stringent federal,
state, and local laws and regulations relating to the protection of the
environment and human health and safety. Environmental laws and
regulations may require that permits be obtained before drilling commences,
restrict the types, quantities, and concentration of various substances that can
be released into the environment in connection with drilling and production
activities, govern the handling and disposal of waste material, and limit or
prohibit drilling activities on certain lands lying within wilderness, wetlands,
and other protected areas, including areas containing endangered animal
species. As a result, these laws and regulations may substantially
increase the costs of exploring for, developing, or producing oil and gas and
may prevent or delay the commencement or continuation of certain
projects. In addition, these laws and regulations may impose
substantial clean-up, remediation, and other obligations in the event of
any discharges or emissions in violation of these laws and
regulations. Further, possible regulations related to global warming
or climate change could have an adverse effect on our operations and the demand
for oil and natural gas. See “Risk Factors – Risks Related to Our
Business - Possible regulations related to global warming or climate change
could have an adverse effect on our operations and the demand for oil and
natural gas.”
Hydraulic
fracturing is a common process in our industry of creating artificial cracks, or
fractures, in deep underground rock formations through the pressurized injection
of water, sand and other additives to enable oil or natural gas to move more
easily through the rock pores to a production well. This process is
often necessary to produce commercial quantities of oil and natural gas from
many reservoirs, especially shale rock formations. We routinely
utilize hydraulic fracturing techniques in many of our reservoirs, and our shale
resource programs utilize or contemplate the utilization of hydraulic
fracturing. Currently, regulation of hydraulic fracturing is
primarily conducted at the state level through permitting and other compliance
requirements. Legislative and regulatory efforts at the federal level
and in some states have been made which could result in additional regulations
and permitting requirements. Those additional regulations and
permitting requirements, as well as other regulatory developments, could lead to
significant operational delays and increased operating costs, and make it more
difficult to perform hydraulic fracturing.
Federal
and state occupational safety and health laws require us to organize and
maintain information about hazardous materials used, released, or produced in
our operations. Some of this information must be provided to our
employees, state and local governmental authorities, and local
citizens. We are also subject to the requirements and reporting
framework set forth in the federal workplace standards.
To date
we have not experienced any materially adverse effect on our operations from
obligations under environmental, health, and safety laws and
regulations. We believe that we are in substantial compliance with
currently applicable environmental, health, and safety laws and regulations, and
that continued compliance with existing requirements would not have a materially
adverse impact on us.
Cautionary
Information about Forward-Looking Statements
This Form
10-K contains “forward-looking statements” within the meaning of Section 27A of
the Securities Act of 1933 and Section 21E of the Securities Exchange Act of
1934. All statements, other than statements of historical facts,
included in this Form 10-K that address activities, events, or developments with
respect to our financial condition, results of operations, or economic
performance that we expect, believe, or anticipate will or may occur in the
future, or that address plans and objectives of management for future
operations, are forward-looking statements. The words “anticipate,”
“assume,” “believe,” “budget,” “estimate,” “expect,” “forecast,” “intend,”
“plan,” “project,” “will,” and similar expressions are intended to identify
forward-looking statements. Forward-looking statements appear in a
number of places in this Form 10-K, and include statements about such matters
as:
|
·
|
The
amount and nature of future capital expenditures and the availability of
liquidity and capital resources to fund capital
expenditures
|
|
·
|
The
drilling of wells and other exploration and development activities and
plans, as well as possible future
acquisitions
|
18
|
·
|
Proved
reserve estimates and the estimates of both future net revenues and the
present value of future net revenues that are included in their
calculation
|
|
·
|
Future
oil and natural gas production
estimates
|
|
·
|
Our
outlook on future oil and natural gas prices and service
costs
|
|
·
|
Cash
flows, anticipated liquidity, and the future repayment of
debt
|
|
·
|
Business
strategies and other plans and objectives for future operations, including
plans for expansion and growth of operations or to defer capital
investment, and our outlook on our future financial condition or results
of operations
|
|
·
|
Other
similar matters such as those discussed in the “Management’s Discussion
and Analysis of Financial Condition and Results of Operations” section in
Item 7 of this Form 10-K.
|
Our
forward-looking statements are based on assumptions and analyses made by us in
light of our experience and our perception of historical trends, current
conditions, expected future developments, and other factors that we believe are
appropriate under the circumstances. These statements are subject to
a number of known and unknown risks and uncertainties which may cause our actual
results and performance to be materially different from any future results or
performance expressed or implied by the forward-looking
statements. These risks are described in the “Risk Factors” section
in Item 1A of this Form 10-K, and include such factors as:
|
·
|
The
volatility and level of realized oil and natural gas
prices
|
|
·
|
A
contraction in demand for oil and natural gas as a result of adverse
general economic conditions or climate change
initiatives
|
|
·
|
The
availability of economically attractive exploration, development, and
property acquisition opportunities and any necessary financing, including
any constraints on the availability of opportunities and financing due to
distressed capital and credit market
conditions
|
|
·
|
Our
ability to replace reserves and sustain
production
|
|
·
|
Unexpected
drilling conditions and results
|
|
·
|
Unsuccessful
exploration and development
drilling
|
|
·
|
The
risks of hedging strategies, including the possibility of realizing lower
prices on oil and natural gas sales as a result of commodity price risk
management activities
|
|
·
|
The
pending nature of reported divestiture plans for certain non-core oil and
gas properties as well as the ability to complete divestiture
transactions
|
|
·
|
The
uncertain nature of the expected benefits from acquisitions and
divestitures of oil and natural gas properties, including uncertainties in
evaluating oil and natural gas reserves of acquired properties and
associated potential liabilities, and uncertainties with respect to the
amount of proceeds that may be received from
divestitures
|
|
·
|
The
imprecise nature of oil and natural gas reserve
estimates
|
|
·
|
Uncertainties
inherent in projecting future rates of production from drilling activities
and acquisitions
|
19
|
·
|
Declines
in the values of our oil and natural gas properties resulting in
impairment charges and write-downs
|
|
·
|
The
ability of purchasers of production to pay for amounts
purchased
|
|
·
|
Drilling
and operating service availability
|
|
·
|
Uncertainties
in cash flow
|
|
·
|
The
financial strength of hedge contract counterparties and credit facility
participants, and the risk that one or more of these parties may not
satisfy their contractual
commitments
|
|
·
|
The
negative impact that lower oil and natural gas prices could have on our
ability to borrow and fund capital
expenditures
|
|
·
|
The
potential effects of increased levels of debt
financing
|
|
·
|
Our
ability to compete effectively against other independent and major oil and
natural gas companies and
|
|
·
|
Litigation,
environmental matters, the potential impact of government regulations, and
the use of management estimates.
|
We
caution you that forward-looking statements are not guarantees of future
performance and that actual results or performance may be materially different
from those expressed or implied in the forward-looking
statements. Although we may from time to time voluntarily update our
prior forward-looking statements, we disclaim any commitment to do so except as
required by securities laws.
Available
Information
Our
Internet website address is www.stmaryland.com. We routinely post
important information for investors on our website. Within our
website’s investor relations section we make available free of charge our annual
reports on Form 10-K, quarterly reports on Form 10-Q, current reports on Form
8-K, and amendments to those reports filed with or furnished to the SEC under
applicable securities laws. These materials are made available as
soon as reasonably practical after we electronically file such materials with or
furnish such materials to the SEC.
We also
make available through our website’s corporate governance section our Corporate
Governance Guidelines, Code of Business Conduct and Ethics, and the Charters for
our Board of Directors’ Audit Committee, Compensation Committee, Executive
Committee, and Nominating and Corporate Governance Committee.
Information
on our website is not incorporated by reference into this Form 10-K and should
not be considered part of this document.
20
Glossary
of Oil and Natural Gas Terms
The oil
and natural gas terms defined in this section are used throughout this Form
10-K. The definitions of the terms developed reserves, exploratory
well, field, proved reserves, and undeveloped reserves have been abbreviated
from the respective definitions under Rule 4-10(a) of Regulation S-X promulgated
by the SEC. The entire definitions of those terms under Rule 4-10(a)
of Regulation S-X can be located through the SEC’s website at
www.sec.gov.
Bbl. One stock
tank barrel, or 42 U.S. gallons liquid volume, used in reference to oil or other
liquid hydrocarbons.
Bcf. Billion cubic feet,
used in reference to natural gas.
BCFE. Billion
cubic feet of natural gas equivalent. Natural gas equivalents are
determined using the volumetric ratio of six Mcf of natural gas to one Bbl of
oil.
BOE. Barrels of
oil equivalent. Oil equivalents are determined using the volumetric
ratio of six Mcf of natural gas to one Bbl of oil.
Development
well. A well drilled within the proved area of an oil or
natural gas reservoir to the depth of a stratigraphic horizon known to be
productive.
Dry hole. A well
found to be incapable of producing either oil or natural gas in commercial
quantities.
Exploratory
well. With respect to wells as of December 31, 2009, and dates
thereafter, the applicable SEC definition of exploratory well is a well drilled
to find a new field or to find a new reservoir in a field previously found to be
productive of oil or natural gas in another reservoir. With respect
to wells as of dates prior to December 31, 2009, the applicable SEC definition
of exploratory well was a well drilled to find and produce oil or natural gas in
an unproved area, to find a new reservoir in a field previously found to be
productive of oil or natural gas in another reservoir, or to extend a known
reservoir.
Farmout. An
assignment of an interest in a drilling location and related acreage conditioned
upon the drilling of a well on that location.
Fee land. The most
extensive interest that can be owned in land, including surface and mineral
(including oil and natural gas) rights.
Field. An area
consisting of a single reservoir or multiple reservoirs all grouped on or
related to the same individual geological structural feature and/or
stratigraphic condition.
Finding
cost. Expressed in dollars per MCFE. Finding cost
metrics provide information as to the cost of adding proved reserves from
various activities, and are widely utilized within the exploration and
production industry, as well as by investors. The information used to
calculate these metrics is included in Note 15 – Oil and Gas Activities and Note
16 – Disclosures about Oil and Gas Producing Activities of the Notes to
Consolidated Financial Statements included in this report. It should
be noted that finding cost metrics have limitations. For example,
exploration efforts related to a particular set of proved reserve additions may
extend over several years.
21
As
a result, the exploration costs incurred in earlier periods are not included in
the amount of exploration costs incurred during the period in which that set of
proved reserves is added. In addition, consistent with industry
practice, future capital costs to develop proved undeveloped reserves are not
included in costs incurred. Since the additional development costs
that will need to be incurred in the future before the proved undeveloped
reserves are ultimately produced are not included in the amount of costs
incurred during the period in which those reserves were added, those development
costs in future periods will be reflected in the costs associated with adding a
different set of reserves. The calculations of various finding cost
metrics are explained below.
Finding cost – Drilling, excluding
revisions. Calculated by dividing the amount of costs incurred
for development and exploration activities, by the amount of estimated net
proved reserves added through discoveries, extensions, and infill drilling,
during the same period.
Finding cost – Drilling, including
revisions. Calculated by dividing the amount of costs incurred
for development and exploration activities, by the amount of estimated net
proved reserves added through discoveries, extensions, and infill drilling, and
revisions of previous estimates during the same period.
Finding cost – Drilling and acquisitions, excluding
revisions. Calculated by dividing the amount of costs incurred for
development, exploration and acquisition of proved properties, by the amount of
estimated net proved reserves added through discoveries, extensions, infill
drilling and acquisitions during the same period.
Finding cost – Drilling and acquisitions, including
revisions. Calculated by dividing the amount of costs incurred for
development, exploration and acquisition of proved properties, by the amount of
estimated net proved reserves added through discoveries, extensions, and infill
drilling, revisions of previous estimates, and acquisitions during the same
period.
Finding cost –All in, including
sales of reserves. Calculated by dividing the amount of total
capital expenditures for oil and natural gas activities, by the amount of
estimated net proved reserves added through discoveries, extensions, infill
drilling, acquisitions, and revisions of previous estimates less sales of
reserves during the same period.
Formation. A
succession of sedimentary beds that were deposited under the same general
geologic conditions.
Gross acre. An
acre in which a working interest is owned.
Gross well. A well
in which a working interest is owned.
Horizontal
wells. Wells which are drilled at angles greater than 70
degrees from vertical.
Lease operating
expenses. The expenses incurred in the lifting of oil or
natural gas from a producing formation to the surface, constituting part of the
current operating expenses of a working interest, and also including labor,
superintendence, supplies, repairs, maintenance, allocated overhead costs, and
other expenses incidental to production, but not including lease acquisition,
drilling, or completion costs.
MBbl. One thousand
barrels of oil or other liquid hydrocarbons.
MMBbl. One million
barrels of oil or other liquid hydrocarbons.
MBOE. One thousand
barrels of oil equivalent. Oil equivalents are determined using the
volumetric ratio of six Mcf of natural gas to one Bbl of oil.
MMBOE. One million
barrels of oil equivalent. Oil equivalents are determined using the
volumetric ratio of six Mcf of natural gas to one Bbl of oil.
Mcf. One thousand
cubic feet, used in reference to natural gas.
22
MCFE. One thousand
cubic feet of natural gas equivalent. Natural gas equivalents are
determined using the volumetric ratio of six Mcf of natural gas to one Bbl of
oil.
MMcf. One million
cubic feet, used in reference to natural gas.
MMCFE. One million
cubic feet of natural gas equivalent. Natural gas equivalents are
determined using the volumetric ratio of six Mcf of natural gas to one Bbl of
oil.
MMBtu. One million
British Thermal Units. A British Thermal Unit is the amount of heat
required to raise the temperature of a one-pound mass of water by one degree
Fahrenheit.
Net acres or net
wells. The sum of our fractional working interests owned in
gross acres or gross wells.
Net asset value per
share. The result of the fair market value of total assets
less total liabilities, divided by the total number of outstanding shares of
common stock.
NYMEX. New York
Mercantile Exchange.
PV-10 value. The
present value of estimated future gross revenue to be generated from the
production of estimated net proved reserves, net of estimated production and
future development costs, based on prices used in estimating the proved
reserves and costs in effect as of the date indicated (unless such costs are
subject to change pursuant to contractual provisions), without giving effect to
non-property related expenses such as general and administrative expenses, debt
service, future income tax expenses, or depreciation, depletion, and
amortization, discounted using an annual discount rate of ten
percent. While this measure does not include the effect of income
taxes as it would in the use of the standardized measure of discounted future
net cash flows calculation, it does provide an indicative representation of the
relative value of the Company on a comparative basis to other companies and from
period to period.
Productive well. A
well that is producing oil or natural gas or that is capable of commercial
production.
Proved
reserves. With respect to reserves as of December 31, 2009,
and dates thereafter, the applicable SEC definition of proved reserves is those
quantities of oil and gas, which, by analysis of geoscience and engineering
data, can be estimated with reasonable certainty to be economically producible –
from a given date forward, from known reservoirs, and under existing economic
conditions, operating methods, and government regulations – prior to the time at
which contracts providing the right to operate expire, unless evidence indicates
that renewal is reasonably certain, regardless of whether deterministic or
probabilistic methods are used for the estimation. Existing economic
conditions include prices and costs at which economic producibility from a
reservoir is to be determined, and the price to be used is the average price
during the 12-month period prior to the ending date of the period covered by the
report, determined as an unweighted arithmetic average of the
first-day-of-the-month price for each month within such period, unless prices
are defined by contractual arrangements, excluding escalations based upon future
conditions. With respect to reserves as of dates prior to
December 31, 2009, the applicable SEC definition of proved reserves
was the estimated quantities of crude oil, natural gas, and natural gas liquids
which geological and engineering data demonstrate with reasonable certainty to
be recoverable in future years from known reservoirs under existing economic and
operating conditions, meaning prices and costs as of the date the estimate is
made.
Recompletion. A
completion in an existing wellbore in a formation other than that in which the
well has previously been completed.
Reserve
life. Expressed in years, represents the estimated net proved
reserves at a specified date divided by actual production for the preceding
12-month period.
Reserve
replacement. Reserve replacement metrics are used as
indicators of a company’s ability to replenish annual production volumes and
grow its reserves, and provide information related to how successful a company
is at growing its proved reserve base. These are believed to be
useful non-GAAP measures that are widely utilized
23
within the exploration and production industry, as well as by
investors. They are easily calculable metrics, and the information used to
calculate these metrics is included in Note 16 – Disclosures about Oil and Gas
Producing Activities of the Notes to Consolidated Financial Statements included
in this report. It should be noted that reserve replacement metrics
have limitations. They are limited because they typically vary widely
based on the extent and timing of new discoveries and property
acquisitions. Their predictive and comparative value is also limited
for the same reasons. In addition, since the metrics do not embed the
cost or timing of future production of new reserves, they cannot be used as a
measure of value creation. The calculations of various reserve
replacement metrics are explained below.
Reservoir. A porous and permeable underground formation containing a natural accumulation of producible oil and/or natural gas that is confined by impermeable rock or water barriers and is individual and separate from other reservoirs.
Reserve replacement – Drilling,
excluding revisions. Calculated as a numerator comprised of
the sum of reserve extensions and discoveries and infill reserves in an existing
proved field divided by production for that same period. This metric is an
indicator of the relative success a company is having in replacing its
production through drilling activity.
Reserve replacement – Drilling,
including revisions. Calculated as a numerator comprised of
the sum of reserve extensions, discoveries, and infill reserves, and revisions
and previous estimates in an existing proved field divided by production for
that same period. This metric is an indicator of the relative success
a company is having in replacing its production through drilling
activity.
Reserve replacement –
Drilling and
acquisitions, excluding revisions. Calculated as a numerator
comprised of the sum of reserve acquisitions and reserve extensions and
discoveries and infill reserves in an existing proved field divided by
production for that same period. This metric is an indicator of the
relative success a company is having in replacing its production through
drilling and acquisition activities.
Reserve replacement –
Drilling and
acquisitions, including revisions. Calculated as a numerator
comprised of the sum of reserve acquisitions and reserve extensions,
discoveries, and infill reserves, and revisions and previous estimates in an
existing proved field divided by production for that same
period. This metric is an indicator of the relative success a company
is having in replacing its production through drilling and acquisition
activities.
Reserve replacement percentage – All
in, excluding sales of reserves. The sum of reserve extensions
and discoveries, infill drilling, reserve acquisitions, and reserve revisions of
previous estimates for a specified period of time divided by production for that
same period.
Reserve replacement percentage –All
in, including sales of reserves. The sum of sales of reserves,
infill drilling, reserve extensions and discoveries, reserve acquisitions, and
reserve revisions of previous estimates for a specified period of time divided
by production for that same period.
Reservoir. A porous and permeable underground formation containing a natural accumulation of producible oil and/or natural gas that is confined by impermeable rock or water barriers and is individual and separate from other reservoirs.
Resource play. A
term used to describe an accumulation of oil and/or natural gas resources known
to exist over a large area expanse, which when compared to a conventional play
typically has a lower expected geological and/or commercial development
risk.
Royalty. The
amount or fee paid to the owner of mineral rights, expressed as a percentage or
fraction of gross income from oil and natural gas produced and sold unencumbered
by expenses relating to the drilling, completing, and operating of the affected
well.
Royalty
interest. An interest in an oil and natural gas property
entitling the owner to shares of oil and natural gas production free of costs of
exploration, development, and production operations.
Seismic. An
exploration method of sending energy waves or sound waves into the earth and
recording the wave reflections to indicate the type, size, shape, and depth of
subsurface rock formations.
24
Shale. Fine-grained
sedimentary rock composed mostly of consolidated clay or mud. Shale
is the most frequently occurring sedimentary rock.
Standardized measure of discounted
future net cash flows. The discounted future net cash flows
relating to proved reserves based on prices used in estimating the reserves,
year-end costs, and statutory tax rates, and a ten percent annual discount
rate. The information for this calculation is included in the note
regarding disclosures about oil and gas producing activities contained in the
Notes to Consolidated Financial Statements included in this Form
10-K.
Undeveloped
acreage. Lease acreage on which wells have not been drilled or
completed to a point that would permit the production of commercial quantities
of oil or natural gas, regardless of whether such acreage contains estimated net
proved reserves.
Undeveloped
reserves. Reserves that are expected to be recovered from new
wells on undrilled acreage, or from existing wells where a relatively major
expenditure is required for recompletion. With respect to reserves as
of December 31, 2009, and dates thereafter, the applicable SEC definition of
undeveloped reserves provides that undrilled locations can be classified as
having undeveloped reserves only if a development
plan has been adopted indicating that they are scheduled to be drilled within
five years, unless the specific circumstances justify a longer
time.
Working
interest. The operating interest that gives the owner the
right to drill, produce, and conduct operating activities on the property and to
share in the production, sales, and costs.
25
ITEM
1A. RISK
FACTORS
In
addition to the other information included in this Form 10-K, the following risk
factors should be carefully considered when evaluating St. Mary.
Risks
Related to Our Business
Oil
and natural gas prices are volatile, and declines in prices adversely affect our
profitability, financial condition, cash flows, access to capital, and ability
to grow.
Our
revenues, operating results, profitability, future rate of growth, and the
carrying value of our oil and natural gas properties depend heavily on the
prices we receive for oil and natural gas sales. Oil and natural gas
prices also affect our cash flows available for capital expenditures and other
items, our borrowing capacity, and the amount and value of our oil and natural
gas reserves. For example, the amount of our borrowing base under our
credit facility is subject to periodic redeterminations based on oil and natural
gas prices specified by our bank group at the time of
redetermination. In addition, we may have oil and natural gas
property impairments or downward revisions of estimates of proved reserves if
prices fall significantly.
Historically,
the markets for oil and natural gas have been volatile and they are likely to
continue to be volatile. Wide fluctuations in oil and natural gas
prices may result from relatively minor changes in the supply of and demand for
oil and natural gas, market uncertainty, and other factors that are beyond our
control, including:
|
·
|
Global
and domestic supplies of oil and natural gas, and the productive capacity
of the industry as a whole
|
|
·
|
The
level of consumer demand for oil and natural
gas
|
|
·
|
Overall
global and domestic economic
conditions
|
|
·
|
Weather
conditions
|
|
·
|
The
availability and capacity of transportation or refining facilities in
regional or localized areas that may affect the realized price for oil or
natural gas
|
|
·
|
The
price and level of foreign imports of crude oil, refined petroleum
products, and liquefied natural gas
|
|
·
|
The
price and availability of alternative
fuels
|
|
·
|
Technological
advances affecting energy
consumption
|
|
·
|
The
ability of the members of the Organization of Petroleum Exporting
Countries to agree to and maintain oil price and production
controls
|
|
·
|
Political
instability or armed conflict in oil or natural gas producing
regions
|
|
·
|
Strengthening
and weakening of the U.S dollar relative to other
currencies
|
|
·
|
Governmental
regulations and taxes.
|
These
factors and the volatility of oil and natural gas markets make it extremely
difficult to predict future oil and natural gas price movements with any
certainty. Declines in oil or natural gas prices would reduce our
revenues and could also reduce the amount of oil and natural gas that we can
produce economically, which could have a materially adverse effect on
us.
26
Continued
weakness in economic conditions or uncertainty in financial markets may have
material adverse impacts on our business that we cannot predict.
U.S. and
global economies and financial systems have recently experienced turmoil and
upheaval characterized by extreme volatility and declines in prices of
securities, diminished liquidity and credit availability, inability to access
capital markets, the bankruptcy, failure, collapse or sale of financial
institutions, increased levels of unemployment, and an unprecedented level of
intervention by the U.S. federal government and other
governments. Although some portions of the economy appear to have
stabilized and there have been signs of the beginning of recovery, the extent
and timing of a recovery, and whether it can be sustained, are
uncertain. Continued weakness in the U.S. or global economies could
materially adversely affect our business and financial condition. For
example:
|
·
|
the
demand for oil and natural gas in the U.S. has declined and may remain at
low levels or further decline if economic conditions remain weak, and
continue to negatively impact our revenues, margins, profitability,
operating cash flows, liquidity and financial
condition
|
|
·
|
the
tightening of credit or lack of credit availability to our customers could
adversely affect our ability to collect our trade
receivables
|
|
·
|
our
ability to access the capital markets may be restricted at a time when we
would like, or need, to raise capital for our business, including for
exploration and/or development of our
reserves
|
|
·
|
our
commodity hedging arrangements could become ineffective if our
counterparties are unable to perform their obligations or seek bankruptcy
protection.
|
If
we are unable to replace reserves, we will not be able to sustain
production.
Our
future operations depend on our ability to find, develop, or acquire oil and
natural gas reserves that are economically producible. Our properties
produce oil and natural gas at a declining rate over time. In order
to maintain current production rates, we must locate and develop or acquire new
oil and natural gas reserves to replace those being depleted by
production. In addition, competition for the acquisition of producing
oil and natural gas properties is intense and many of our competitors have
financial and other resources needed to evaluate and integrate acquisitions that
are substantially greater than those available to us. Therefore, we
may not be able to acquire oil and natural gas properties that contain
economically producible reserves, or we may not be able to acquire such
properties at prices acceptable to us. Without successful drilling or
acquisition activities, our reserves, production, and revenues will decline over
time.
Substantial
capital is required to replace our reserves.
We must
make substantial capital expenditures to find, acquire, develop, and produce oil
and natural gas reserves. Future cash flows and the availability of
financing are subject to a number of factors, such as the level of production
from existing wells, prices received for oil and natural gas sales, our success
in locating and developing and acquiring new reserves, and the orderly
functioning of credit and capital markets. When oil or natural gas
prices decrease or if we encounter operating difficulties that result in our
cash flows from operations being less than expected, we must reduce our capital
expenditures unless we can raise additional funds through debt or equity
financing or the divestment of assets. Debt or equity financing may
not always be available to us in sufficient amounts or on acceptable terms, and
the proceeds offered to us for potential divestitures may not always be of
acceptable value to us.
When our
revenues decrease due to lower oil or natural gas prices, decreased production,
or other reasons, and if we cannot obtain capital through our revolving credit
facility, other acceptable debt or equity financing arrangements, or the sale of
non-core assets, our ability to execute development plans, replace our reserves,
secure our acreage, or maintain production levels could be greatly
limited.
27
The debt
and equity financing markets have recently been constrained due to the global
and domestic economic and financial downturn, and it is possible that
circumstances may arise where one or more of the twelve participating banks in
our credit facility, at some point, may not be able to fulfill their portion of
the lending commitments to us under the facility. Adverse conditions
in the credit markets may increase the cost of borrowings and decrease our
ability to access new sources of capital.
Competition
in our industry is intense, and many of our competitors have greater financial,
technical, and human resources than we do.
We face
intense competition from major oil companies, independent oil and natural gas
exploration and production companies, financial buyers, and institutional and
individual investors who seek oil and natural gas property investments
throughout the world, as well as the equipment, expertise, labor, and materials
required to operate oil and natural gas properties. Many of our
competitors have financial, technical, and other resources vastly exceeding
those available to us, and many oil and natural gas properties are sold in a
competitive bidding process in which our competitors may be able and willing to
pay more for development prospects and productive properties, or in which our
competitors have technological information or expertise that is not available to
us to evaluate and successfully bid for the properties. In addition,
shortages of equipment, labor, or materials as a result of intense competition
may result in increased costs or the inability to obtain those resources as
needed. We may not be successful in acquiring and developing
profitable properties in the face of this competition.
We also
compete for human resources. Over the last few years, the need for
talented people across all disciplines in the industry has grown, while the
number of people available has been constrained.
The
actual quantities and present values of our proved oil and natural gas reserves
may be less than we have estimated.
This Form
10-K and other SEC filings by us contain estimates of our proved oil and natural
gas reserves and the estimated future net revenues from those
reserves. These estimates are based on various assumptions, including
assumptions required by the SEC relating to oil and natural gas prices, drilling
and operating expenses, capital expenditures, taxes, timing of operations, and
availability of funds. The process of estimating oil and natural gas
reserves is complex. The process involves significant decisions and
assumptions in the evaluation of available geological, geophysical, engineering,
and economic data for each reservoir. These estimates are dependent
on many variables, and therefore changes often occur as these variables
evolve. Therefore, these estimates are inherently
imprecise.
Actual
future production, oil and natural gas prices, revenues, production taxes,
development expenditures, operating expenses, and quantities of producible oil
and natural gas reserves will most likely vary from those
estimated. Any significant variance could materially affect the
estimated quantities of and present values related to proved reserves disclosed
by us, and the actual quantities and present values may be less than we have
previously estimated. In addition, we may adjust estimates of proved
reserves to reflect production history, results of exploration and development
activity, prevailing oil and natural gas prices, costs to develop and operate
properties, and other factors, many of which are beyond our
control. Our properties may also be susceptible to hydrocarbon
drainage from production on adjacent properties.
As of
December 31, 2009, approximately 18 percent, or 142 BCFE, of our estimated
proved reserves were proved undeveloped, and approximately 9 percent, or 73
BCFE, were proved developed non-producing. Estimates of proved
undeveloped reserves and proved developed non-producing reserves are nearly
always based on volumetric calculations rather than the performance data used to
estimate producing reserves. In order to develop our proved
undeveloped reserves, we estimate approximately $296 million of capital
expenditures would be required. Production revenues from proved
developed non-producing reserves will not be realized until sometime in the
future and after some investment of capital. In order to bring
production on-line for our proved developed non-producing reserves, we estimate
capital expenditures of approximately $44 million will be deployed in future
years. Although we have estimated our reserves and the costs
associated with these reserves in accordance with industry standards, estimated
costs may not be accurate, development may not occur as scheduled and actual
results may not occur as estimated. The balance of our currently
anticipated capital
28
expenditures
for 2010 is directed towards projects that are not yet classified within the
construct of proved reserves as defined by Regulation S-X promulgated by the
SEC.
You
should not assume that the PV-10 value and standardized measure of discounted
future net cash flows included in this Form 10-K represent the current market
value of our estimated proved oil and natural gas
reserves. Management has based the estimated discounted future net
cash flows from proved reserves on price and cost assumptions required by the
SEC, whereas actual future prices and costs may be materially higher or
lower. For example, values of our reserves as of December 31, 2009,
were estimated using a calculated 12-month average sales price of $3.87 per
MMBtu of natural gas (NYMEX Henry Hub spot price) and $61.18 per Bbl of oil
(NYMEX West Texas Intermediate spot price). We then adjust these base
prices to reflect appropriate basis, quality, and location differentials over
that period in estimating our proved reserves. During 2009, our
monthly average realized natural gas prices, excluding the effect of hedging,
were as high as $5.48 per Mcf and as low as $2.96 per Mcf. For the
same period, our monthly average realized oil prices before hedging were as high
as $70.31 per Bbl and as low as $30.37 per Bbl. Many other factors
will affect actual future net cash flows, including:
|
·
|
Amount
and timing of actual production
|
|
·
|
Supply
and demand for oil and natural gas
|
|
·
|
Curtailments
or increases in consumption by oil purchasers and natural gas
pipelines
|
|
·
|
Changes
in government regulations or taxes.
|
The
timing of production from oil and natural gas properties and of related expenses
affects the timing of actual future net cash flows from proved reserves, and
thus their actual present value. Our actual future net cash flows
could be less than the estimated future net cash flows for purposes of computing
PV-10 values. In addition, the ten percent discount factor required
by the SEC to be used to calculate PV-10 values for reporting purposes is not
necessarily the most appropriate discount factor given actual interest rates,
costs of capital, and other risks to which our business and the oil and natural
gas industry in general are subject.
Reserve
estimates as of December 31, 2009, have been prepared under the SEC’s new rules
for oil and gas reporting that are effective for fiscal years ending on or after
December 31, 2009. These new rules require SEC reporting companies to
prepare their reserve estimates using, among other things, revised reserve
definitions and revised pricing based on 12-month unweighted
first-day-of-the-month average pricing, instead of the prior requirement to use
pricing at the end of the period. The SEC has released only limited
interpretive guidance regarding reporting of reserve estimates under the new
rules and may not issue further interpretive guidance on the new rules in the
near future. The interpretation of these rules and their
applicability in different situations remains unclear in many
respects. Changing interpretations of the rules or disagreements with
our interpretations could result in revisions to our reserve estimates or
write-downs in our reserves.
Our
property acquisitions may not be worth what we paid due to uncertainties in
evaluating recoverable reserves and other expected benefits, as well as
potential liabilities.
Successful
property acquisitions require an assessment of a number of factors beyond our
control. These factors include exploration potential, future oil and
natural gas prices, operating costs, and potential environmental and other
liabilities. These assessments are not precise and their accuracy is
inherently uncertain.
In
connection with our acquisitions, we perform a customary review of the acquired
properties that will not necessarily reveal all existing or potential
problems. In addition, our review may not allow us to fully assess
the potential deficiencies of the properties. We do not inspect every
well, and even when we inspect a well we may not discover structural,
subsurface, or environmental problems that may exist or arise. We may
not be entitled to contractual indemnification for pre-closing liabilities,
including environmental liabilities. Normally, we acquire interests
in properties on an “as is” basis with limited remedies for breaches of
representations and warranties.
In
addition, significant acquisitions can change the nature of our operations and
business if the acquired properties have substantially different operating and
geological characteristics or are in different geographic locations than our
existing properties. To the extent acquired properties are
substantially different than our existing properties, our ability to efficiently
realize the expected economic benefits of such acquisitions may be
limited.
Integrating
acquired properties and businesses involves a number of other special risks,
including the risk that management may be distracted from normal business
concerns by the need to integrate operations and systems as well as retain and
assimilate additional employees. Therefore, we may not be able to
realize all of the anticipated benefits of our acquisitions.
Exploration
and development drilling may not result in commercially producible
reserves.
Oil and
natural gas drilling and production activities are subject to numerous risks,
including the risk that no commercially producible oil or natural gas will be
found. The cost of drilling and completing wells is often uncertain,
and oil and natural gas drilling and production activities may be shortened,
delayed, or canceled as a result of a variety of factors, many of which are
beyond our control. These factors include:
|
·
|
Unexpected
drilling conditions
|
|
·
|
Title
problems
|
|
·
|
Pressure
or geologic irregularities in
formations
|
|
·
|
Equipment
failures or accidents
|
|
·
|
Hurricanes
or other adverse weather conditions
|
|
·
|
Compliance
with environmental and other governmental
requirements
|
|
·
|
Shortages
or delays in the availability of or increases in the cost of drilling rigs
and crews, fracture stimulation crews and equipment, chemicals, and
supplies.
|
The
prevailing prices of oil and natural gas affect the cost of and the demand for
drilling rigs, production equipment, and related services. However,
changes in costs may not occur simultaneously with corresponding changes in
commodity prices. The availability of drilling rigs can vary
significantly from region to region at any particular time. Although
land drilling rigs can be moved from one region to another in response to
changes in levels of demand, an undersupply of rigs in any region may result in
drilling
delays and higher drilling costs for the rigs that are available in that
region. In addition, the recent economic and financial downturn has
adversely affected the financial condition of some drilling contractors, which
may constrain the availability of drilling services in some areas.
Another
significant risk inherent in our drilling plans is the need to obtain drilling
permits from state, local, and other governmental authorities. Delays
in obtaining regulatory approvals and drilling permits, including delays which
jeopardize our ability to realize the potential benefits from leased properties
within the applicable lease periods, the failure to obtain a drilling permit for
a well, or the receipt of a permit with unreasonable conditions or costs could
have a materially adverse effect on our ability to explore on or develop our
properties.
The wells
we drill may not be productive and we may not recover all or any portion of our
investment in such wells. The seismic data and other technologies we
use do not allow us to know conclusively prior to drilling a well if oil or
natural gas is present, or whether it can be produced
economically. The cost of drilling, completing, and operating a well
is often uncertain, and cost factors can adversely affect the economics of a
project. Drilling activities can result in dry holes or wells that
are productive but do not produce sufficient net revenues after operating and
other costs to cover initial drilling and completion costs.
30
Drilling
results in our newer shale plays, such as the Eagle Ford, Haynesville, and
Marcellus shales, may be more uncertain than in shale plays that are more
developed and have longer established production histories. For
example, our experience with horizontal drilling in these shales, as well as the
industry’s drilling and production history, is more limited than in the Woodford
shale play, and we have less information with respect to the ultimate
recoverable reserves and the production decline rates in these shales than we
have in other areas in which we operate. Completion techniques that
have proven to be successful in other shale formations to maximize recoveries
are being used in the early development of these new shales; however, we can
provide no assurance of the ultimate success of these drilling and completion
techniques. Moreover, the recent growth in exploration in the
Marcellus shale has drawn intense scrutiny from environmental interest groups,
regulatory agencies, and other governmental entities. As a result, we
may face significant opposition to our operations in that area that may make it
difficult to obtain permits and other needed authorizations to operate or
otherwise make operating more costly or difficult than operating
elsewhere.
In
addition, a significant part of our strategy involves increasing our drilling
location inventories for multi-year programs scheduled out over several
years. Such multi-year drilling inventories can be more susceptible
to long-term horizon uncertainties that could materially alter the occurrence or
timing of actual drilling. Because of these uncertainties, we do not
know if the potential drilling locations we have identified will ever be
drilled, although we have the present intent to do so, or if we will be able to
produce oil or natural gas from these or any other potential drilling
locations.
Our
future drilling activities may not be successful. Our overall
drilling success rate or our drilling success rate within a particular area may
decline. In addition, we may not be able to obtain any options or
lease rights in potential drilling locations that we
identify. Although we have identified numerous potential drilling
locations, we may not be able to economically produce oil or natural gas from
all of them.
Our
hedging activities may result in financial losses or may limit the prices that
we receive for oil and natural gas sales.
To manage
our exposure to price risks in the sale of our oil and natural gas production,
we enter into commodity price risk management arrangements periodically with
respect to a portion of our current or future production. We have
hedged a significant portion of anticipated future production from our currently
producing properties using zero-cost collars and swaps. As of
December 31, 2009, we were in a net accrued liability position of approximately
$81 million with respect to our oil and natural gas hedging activities. These
activities may expose us to the risk of financial loss in certain circumstances,
including instances in which:
|
·
|
Our
production is less than expected
|
|
·
|
One
or more counterparties to our hedge contracts default on their contractual
obligations
|
|
·
|
There
is a widening of price differentials between delivery points for our
production and the delivery point assumed in the hedge
arrangement.
|
The risk
of one or more counterparties defaulting on their obligations is heightened by
the recent global and domestic economic and financial downturn affecting many
banks and other financial institutions, including our counterparties and their
affiliates. These circumstances may adversely affect the ability of
our counterparties to meet their obligations to us pursuant to hedge
transactions, which could reduce our revenues and cash flows from realized hedge
settlements. As a result, our financial condition, results of
operations, and cash flows could be materially adversely affected if our
counterparties default on their contractual obligations under our hedge
contracts.
In
addition, commodity price hedging may limit the prices that we receive for our
oil and natural gas sales if oil or natural gas prices rise substantially over
the price established by the hedge. Some of our hedging transactions
use derivative instruments that may involve basis risk. Basis risk in
a hedging contract can occur when the change in the index upon which the hedge
is based does not correlate well to the change in the index upon which the
hedged production is valued, thereby making the hedge less
effective. For example, a change in
31
the NYMEX
price used for hedging certain volumes of production may not correlate exactly
to the change in the regional price used for the sale of that
production.
The
inability of one or more of our customers to meet their obligations may
adversely affect our financial results.
Substantially
all of our accounts receivable result from oil and natural gas sales or joint
interest billings to third parties in the energy industry. This
concentration of customers and joint interest owners may impact our overall
credit risk in that these entities may be similarly affected by various economic
and other conditions, including the recent global and domestic economic and
financial downturn.
Future
oil and natural gas price declines or unsuccessful exploration efforts may
result in write-downs of our asset carrying values.
We follow
the successful efforts method of accounting for our oil and natural gas
properties. All property acquisition costs and costs of exploratory
and development wells are capitalized when incurred, pending the determination
of whether proved reserves have been discovered. If proved reserves
are not discovered with an exploratory well, the costs of drilling the well are
expensed.
The
capitalized costs of our oil and natural gas properties, on a field basis,
cannot exceed the estimated undiscounted future net cash flows of that
field. If net capitalized costs exceed undiscounted future net
revenues, we generally must write down the costs of each such field to the
estimated discounted future net cash flows of that field. Unproved
properties are evaluated at the lower of cost or fair market
value. As a result of significant oil and natural gas price declines
in the second half of 2008, we incurred impairment of proved property
write-downs, impairment of unproved properties, and goodwill impairment totaling
$302.2 million, $39.0 million, and $9.5 million, respectively, during
2008. In addition, we incurred impairment of proved property
write-downs and impairment of unproved properties totaling $174.8 million and
$45.4 million, respectively, during 2009. Significant further
declines in oil or natural gas prices in the future or unsuccessful exploration
efforts could cause further impairment write-downs of capitalized
costs.
We review
the carrying value of our properties quarterly based on prices in effect as of
the end of each quarter. Once incurred, a write-down of oil and
natural gas properties cannot be reversed at a later date, even if oil or
natural gas prices increase.
Lower
oil or natural gas prices could limit our ability to borrow under our revolving
credit facility.
Our
revolving credit facility has a maximum commitment amount of $678 million,
subject to a borrowing base that the lenders periodically redetermine based on
the bank group’s assessment of the value of our oil and natural gas properties,
which in turn is based in part on oil and natural gas prices. The
current borrowing base under our credit facility is $900 million, which was
determined as of September 29, 2009. Declines in oil or natural gas
prices in the future could limit our borrowing base and reduce our ability to
borrow under the credit facility. Additionally, the pending
divestitures of non-core properties could result in a reduction of our borrowing
base.
Our
amount of debt may limit our ability to obtain financing for acquisitions, make
us more vulnerable to adverse economic conditions, and make it more difficult
for us to make payments on our debt.
As of
December 31, 2009, we had $267 million, net of debt discount, of total long-term
senior unsecured debt outstanding under our 3.50% Senior Convertible Notes due
2027, and $188 million of secured debt outstanding under our revolving credit
facility. As of February 16, 2010, we had an outstanding balance of
$211.0 million drawn against our revolving credit facility, resulting in
$467.0 million of available debt capacity under our revolving credit
facility assuming the borrowing conditions of this facility were
met. Our long-term debt represented 32 percent of our total book
capitalization as of December 31, 2009.
32
Our
amount of debt could have important consequences for our operations,
including:
|
·
|
Making
it more difficult for us to obtain additional financing in the future for
our operations and potential acquisitions, working capital requirements,
capital expenditures, debt service, or other general corporate
requirements
|
|
·
|
Requiring
us to dedicate a substantial portion of our cash flows from operations to
the repayment of our debt and the service of interest costs associated
with our debt, rather than to productive
investments
|
|
·
|
Limiting
our operating flexibility due to financial and other restrictive
covenants, including restrictions on incurring additional debt, making
acquisitions, and paying dividends
|
|
·
|
Placing
us at a competitive disadvantage compared to our competitors that have
less debt
|
|
·
|
Making
us more vulnerable in the event of adverse economic or industry conditions
or a downturn in our business.
|
Our
ability to make payments on our debt and to refinance our debt and fund planned
capital expenditures will depend on our ability to generate cash in the
future. This, to a certain extent, is subject to general economic,
financial, competitive, legislative, regulatory, and other factors that are
beyond our control. If our business does not generate sufficient cash
flow from operations or future sufficient borrowings are not available to us
under our revolving credit facility or from other sources, we might not be able
to service our debt or fund our other liquidity needs. If we are
unable to service our debt, due to inadequate liquidity or otherwise, we may
have to delay or cancel acquisitions, defer capital expenditures, sell equity
securities, sell assets, or restructure or refinance our debt. We
might not be able to sell our equity securities, sell our assets, or restructure
or refinance our debt on a timely basis or on satisfactory terms or at
all. In addition, the terms of our existing or future debt
agreements, including our existing and future credit agreements, may prohibit us
from pursuing any of these alternatives. The indenture for our 3.50%
Senior Convertible Notes due 2027 provides that under certain circumstances we
have the option to settle
our obligations under these notes through the issuance of shares of our common
stock if we so elect.
Our debt
instruments, including our revolving credit facility agreement, also permit us
to incur additional debt in the future. In addition, the entities we
may acquire in the future could have significant amounts of debt outstanding
which we could be required to assume in connection with the acquisition, or we
may incur our own significant indebtedness to consummate an
acquisition.
As
discussed above, our revolving credit facility is subject to periodic borrowing
base redeterminations. We could be forced to repay a portion of our
bank borrowings in the event of a downward redetermination of our borrowing
base, and we may not have sufficient funds to make such repayment at that
time. If we do not have sufficient funds and are otherwise unable to
negotiate renewals of our borrowing base or arrange new financing, we may be
forced to sell significant assets.
We
are subject to operating and environmental risks and hazards that could result
in substantial losses.
Oil and
natural gas operations are subject to many risks, including well blowouts,
craterings, explosions, uncontrollable flows of oil, natural gas, or well
fluids, fires, adverse weather such as hurricanes in the South Texas & Gulf
Coast region, freezing conditions, formations with abnormal pressures, pipeline
ruptures or spills, pollution, releases of toxic gas, and other environmental
risks and hazards. If any of these types of events occurs, we could
sustain substantial losses.
Under
certain limited circumstances we may be liable for environmental damage caused
by previous owners or operators of properties that we own, lease, or
operate. As a result, we may incur substantial liabilities to third
parties or governmental entities, which could reduce or eliminate funds
available for exploration, development, or acquisitions, or cause us to incur
losses.
33
We
maintain insurance against some, but not all, of these potential risks and
losses. We have significant but limited coverage for sudden
environmental damages. We do not believe that insurance coverage for
the full potential liability that could be caused by sudden environmental
damages or insurance coverage for environmental damage that occurs over time is
available at a reasonable cost. In addition, pollution and
environmental risks generally are not fully insurable. Further, we
may elect not to obtain other insurance coverage under circumstances where we
believe that the cost of available insurance is excessive relative to the risks
presented. Accordingly, we may be subject to liability or may lose
substantial portions of certain properties in the event of environmental or
other damages. If a significant accident or other event occurs and is
not fully covered by insurance, we could suffer a material loss.
Following
the severe Atlantic hurricanes in 2004, 2005, and 2008, the insurance markets
suffered significant losses. As a result, insurance coverage for wind
storms has become substantially more expensive, and future availability and
costs of coverage are uncertain.
Our
operations are subject to complex laws and regulations, including environmental
regulations that result in substantial costs and other risks.
Federal,
state, and local authorities extensively regulate the oil and natural gas
industry. Legislation and regulations affecting the industry are
under constant review for amendment or expansion, raising the possibility of
changes that may affect, among other things, the pricing or marketing of oil and
natural gas production. Noncompliance with statutes and regulations
may lead to substantial penalties and the overall regulatory burden on the
industry increases the cost of doing business and, in turn, decreases
profitability.
Governmental
authorities regulate various aspects of oil and natural gas drilling and
production, including the drilling of wells (through permit and bonding
requirements), the spacing of wells, the unitization or pooling of interests in
oil and natural gas properties, environmental matters, safety standards, the
sharing of markets, production limitations, plugging and abandonment standards,
and restoration. Under
certain circumstances, federal authorities may require any of our ongoing or
planned operations on federal leases to be delayed, suspended, or
terminated. Any such delay, suspension, or termination could have a
materially adverse effect on our operations.
Our
operations are also subject to complex and constantly changing environmental
laws and regulations adopted by federal, state, and local governmental
authorities in jurisdictions where we are engaged in exploration or production
operations. New laws or regulations, or changes to current
requirements, could result in material costs or claims with respect to
properties we own or have owned. We will continue to be subject to
uncertainty associated with new regulatory interpretations and inconsistent
interpretations between state and federal agencies. Under existing or
future environmental laws and regulations, we could face significant liability
to governmental authorities and third parties, including joint and several as
well as strict liability, for discharges of oil, natural gas, or other
pollutants into the air, soil, or water, and we could be required to spend
substantial amounts on investigations, litigation, and
remediation. Existing environmental laws or regulations, as currently
interpreted or enforced, or as they may be interpreted, enforced, or altered in
the future, may have a materially adverse effect on us.
Proposed
federal and state legislation and regulatory initiatives relating to hydraulic
fracturing could result in increased costs and additional operating restrictions
or delays.
The U.S.
Congress is currently considering legislation that would amend the Safe Drinking
Water Act to eliminate an existing exemption from federal regulation of
hydraulic fracturing activities and require the disclosure of chemical additives
used by the oil and gas industry in the hydraulic fracturing
process. Hydraulic fracturing is a common process in our industry of
creating artificial cracks, or fractures, in deep underground rock formations
through the pressurized injection of water, sand and other additives to enable
oil or natural gas to move more easily through the rock pores to a production
well. This process is often necessary to produce commercial
quantities of oil and natural gas from many reservoirs, especially shale rock
formations. We routinely utilize hydraulic fracturing techniques in
many of our reservoirs, and our Eagle Ford, Haynesville, Marcellus, and Woodford
shale programs utilize or contemplate the utilization of hydraulic
fracturing. Currently,
34
regulation
of hydraulic fracturing is primarily conducted at the state level through
permitting and other compliance requirements. If adopted, the
proposed amendment to the Safe Drinking Water Act could result in additional
regulations and permitting requirements at the federal level. In
addition, various states are also studying or considering various additional
regulatory measures related to hydraulic fracturing. Additional
regulations and permitting requirements could lead to significant operational
delays and increased operating costs, and make it more difficult to perform
hydraulic fracturing.
Proposed
legislation to eliminate or reduce certain federal income tax incentives and
deductions available to oil and gas exploration and production companies could,
if enacted into law, have a material adverse effect on our results of operations
and cash flows.
In 2009,
the “Oil Industry Tax Break Repeal Act of 2009” was introduced in the U.S.
Senate. This bill proposes amendments to the Internal Revenue Code of
1986 to eliminate or reduce certain federal income tax incentives and deductions
currently available to oil and gas exploration and production
companies. The proposed amendments include the elimination or
reduction of current deductions for intangible drilling and development costs,
percentage depletion allowances, and the manufacturing deduction for oil and gas
properties. President Obama’s proposed Fiscal Year 2011 Budget also
contemplates these proposed tax law amendments. If some or all of
these provisions are enacted into law, our effective tax rate and current income
tax expense will increase, potentially significantly, which would increase cash
requirements to pay income tax thereby reducing cash flows from operating
activities, which in turn will reduce cash available for drilling and other
exploration and development activities.
Enactment
of a Pennsylvania severance tax on natural gas could adversely impact the
economic viability of exploiting natural gas drilling and production
opportunities in our Marcellus Shale resource play.
The
Governor of the Commonwealth of Pennsylvania has proposed to its legislature the
adoption of a severance tax on the production of natural gas in
Pennsylvania. The amount of the proposed tax is five percent of the
value of the natural gas at the wellhead, plus $0.047 per Mcf of natural gas
severed. Our Marcellus Shale acreage is located in
Pennsylvania. If Pennsylvania adopts such a severance tax, it could
impact the economic viability of exploiting natural gas drilling and production
opportunities in the Marcellus Shale.
Possible
legislation and regulations related to global warming and climate change could
have an adverse effect on our operations and the demand for oil and natural
gas.
On
December 15, 2009, the U.S. Environmental Protection Agency (EPA) officially
published its findings that emissions of carbon dioxide, which is a byproduct of
the burning of refined oil products and natural gas, methane, which is a primary
component of natural gas, and other “greenhouse gases” present an endangerment
to human health and the environment because emissions of such gases are,
according to the EPA, contributing to warming of the Earth’s atmosphere and
other climatic changes. These findings by the EPA allow the agency to
proceed with the adoption and implementation of regulations that would restrict
emissions of greenhouse gases under existing provisions of the federal Clean Air
Act. In late September 2009, the EPA had proposed two sets of
regulations in anticipation of finalizing its findings that would require a
reduction in emissions of greenhouse gases from motor vehicles and that could
also lead to the imposition of greenhouse gas emission limitations in Clean Air
Act permits for certain stationary sources. In addition, on September
22, 2009, the EPA issued a final rule requiring the reporting of greenhouse gas
emissions from specified large greenhouse gas emission sources in the United
States beginning in 2011 for emissions occurring in 2010. The
adoption and implementation of any regulations imposing reporting obligations
on, or limiting emissions of greenhouse gases from, our equipment and operations
could require us to incur increased costs to reduce emissions of greenhouse
gases associated with our operations and could adversely affect demand for the
oil and natural gas that we produce.
In
addition, on June 26, 2009, the U.S. House of Representatives passed the
“American Clean Energy and Security Act of 2009” (ACESA), which would establish
an economy-wide cap-and-trade program to reduce U.S. emissions of greenhouse
gases, including carbon dioxide and methane. ACESA would require a
17% reduction in
greenhouse
gas emissions from 2005 levels by 2020, and just over an 80% reduction of such
emissions by 2050. Under this legislation, the EPA would issue a
capped and steadily declining number of tradable emissions allowances to certain
major sources of greenhouse gas emissions so that such sources could continue to
emit greenhouse gases into the atmosphere. The cost of these
allowances would be expected to escalate significantly over time. The
net effect of ACESA would be to impose increasing costs on the combustion of
carbon-based fuels such as oil, refined petroleum products, and natural
gas. The U.S. Senate has begun work on its own legislation for
restricting domestic greenhouse gas emissions, and the Obama administration has
indicated its support of legislation to reduce greenhouse gas emissions through
an emission allowance system. In addition, several states have
considered initiatives to regulate emissions of greenhouse gases, primarily
through the planned development of greenhouse gas emissions inventories and/or
regional greenhouse gas cap and trade programs. Although it is not
possible at this time to predict when the U.S. Senate may act on climate change
legislation or how any bill passed by the Senate would be reconciled with ACESA,
any future federal or state laws or regulations that may be adopted to address
greenhouse gas emissions could require us to incur increased operating costs and
could adversely affect the demand for the oil and natural gas that we
produce.
The
adoption of derivatives legislation by Congress and related regulations could
have an adverse impact on our ability to hedge risks associated with our
business.
The U.S.
Congress is currently considering legislation to increase the regulatory
oversight of the over-the-counter derivatives markets in order to promote more
transparency in those markets, and impose restrictions on certain derivatives
transactions, which could affect the use of derivatives in hedging
transactions. ACESA contains provisions that would prohibit private
energy commodity derivative and hedging transactions. ACESA would
expand the power of the Commodity Futures Trading Commission (CFTC) to regulate
derivative transactions related to energy commodities, including oil and natural
gas, and to mandate clearance of such derivative contracts through registered
derivative clearing organizations. Under ACESA, the CFTC’s expanded
authority over energy derivatives would terminate upon the adoption of general
legislation covering derivative regulatory reform. The Chairman of
the CFTC has announced that the CFTC intends to conduct hearings to determine
whether to set limits on trading and positions in commodities with finite
supply, particularly energy commodities, such as crude oil, natural gas and
other energy products. The CFTC also is evaluating whether position
limits should be applied consistently across all markets and
participants. In addition, the Treasury Department recently has
indicated that it intends to propose legislation to subject all OTC derivative
dealers and all other major OTC derivative market participants to substantial
supervision and regulation, including by imposing conservative capital and
margin requirements and strong business conduct standards. Derivative
contracts that are not cleared through central clearinghouses and exchanges may
be subject to substantially higher capital and margin
requirements. Although it is not possible at this time to predict
whether or when Congress may act on derivatives legislation or how any climate
change bill approved by the Senate would be reconciled with ACESA, any new laws
or regulations in this area may result in increased costs and cash collateral
requirements for the types of oil and gas derivative instruments we use to hedge
and otherwise manage our financial risks related to swings in oil and gas
commodity prices, may impose additional restrictions on our trading and
commodity positions, and could have an adverse effect on our ability to hedge
risks associated with our business and on the cost of our hedging
activity.
Our
ability to sell oil and natural gas and/or receive market prices for our oil and
natural gas production may be adversely affected by constraints on pipelines and
gathering systems owned by others and various transportation
interruptions.
The
marketability of our oil and natural gas production depends in part on the
availability, proximity, and capacity of pipeline transportation and gathering
systems owned by third parties. The lack of available transportation
capacity on these systems and facilities could result in the shutting-in of
producing wells, the delay or discontinuance of development plans for
properties, or lower price realizations. Although we have some
contractual control over the transportation of our production, material changes
in these business relationships could materially affect our
operations. Federal and state regulation of oil and natural gas
production and transportation, tax and energy policies, changes in supply and
demand, pipeline pressures, damage to or
36
destruction
of pipelines, and general economic conditions could adversely affect our ability
to produce, gather, and transport oil and natural gas.
In
particular, if drilling in the Eagle Ford, Haynesville, and Marcellus shales
continues to be successful, the amount of natural gas being produced by us and
others could exceed the capacity of the various gathering and intrastate or
interstate transportation pipelines currently available in these
areas. If this occurs, it will be necessary for new pipelines and
gathering systems to be built. Because of the current economic
climate, certain pipeline projects that are being considered for these areas may
not be developed due to lack of financing. In addition, capital
constraints could limit our ability to build intrastate gathering systems
necessary to transport our gas to interstate pipelines. In such
event, we might have to shut in our wells to wait for a pipeline connection or
capacity and/or sell natural gas production at significantly lower prices than
those quoted on NYMEX, which would adversely affect our results of operations
and cash flows.
A portion
of our natural gas and oil production in any region may be interrupted, or shut
in, from time to time for numerous reasons, including as a result of weather
conditions, accidents, loss of pipeline or gathering system access, field labor
issues or strikes, or we might voluntarily curtail production in response to
market conditions. If a substantial amount of our production is
interrupted at the same time, it could temporarily adversely affect our cash
flows.
New
technologies may cause our current exploration and drilling methods to become
obsolete.
The oil
and gas industry is subject to rapid and significant advancements in technology,
including the introduction of new products and services using new
technologies. As competitors use or develop new technologies, we may
be placed at a competitive disadvantage, and competitive pressures may force us
to implement new technologies at a substantial cost. In addition,
competitors may have greater financial, technical and personnel resources that
allow them to enjoy technological advantages and may in the future allow them to
implement new technologies before we can. One or more of the
technologies that we currently use or that we may implement in the future may
become obsolete. We cannot be certain that we will be able to
implement technologies on a timely basis or at a cost that is acceptable to
us. If we are unable to maintain technological advancements
consistent with industry standards, our operations and financial condition may
be adversely affected.
Risks
Related to Our Common Stock
The
price of our common stock may fluctuate significantly, which may result in
losses for investors.
From
January 1, 2009 to February 16, 2010, the closing daily sales price of our
common stock as reported by the New York Stock Exchange ranged from a low of
$11.58 per share to a high of $37.89 per share. We expect our stock
to continue to be subject to fluctuations as a result of a variety of factors,
including factors beyond our control. These factors
include:
|
·
|
Changes
in oil or natural gas prices
|
|
·
|
Variations
in quarterly drilling, recompletions, acquisitions, and operating
results
|
|
·
|
Changes
in financial estimates by securities
analysts
|
|
·
|
Changes
in market valuations of comparable
companies
|
|
·
|
Additions
or departures of key personnel
|
|
·
|
Future
sales of our common stock
|
|
·
|
Changes
in the national and global economic
outlook.
|
37
We may
fail to meet expectations of our stockholders and/or of securities analysts at
some time in the future, and our stock price could decline as a
result.
Our
certificate of incorporation and by-laws have provisions that discourage
corporate takeovers and could prevent stockholders from receiving a takeover
premium on their investment.
Our
certificate of incorporation and by-laws contain provisions that may have the
effect of delaying or preventing a change of control. These
provisions, among other things, provide for non-cumulative voting in the
election of members of the Board of Directors and impose procedural requirements
on stockholders who wish to make nominations for the election of Directors or
propose other actions at stockholder meetings. These provisions,
alone or in combination with each other and with the shareholder rights plan
described below, may discourage transactions involving actual or
potential changes of control, including transactions that otherwise could
involve payment of a premium over prevailing market prices to stockholders for
their common stock.
Under our
shareholder rights plan, if the Board of Directors determines that the terms of
a potential acquisition do not reflect the long-term value of St. Mary, the
Board of Directors could allow the holder of each outstanding share of our
common stock, other than those held by the potential acquirer, to purchase one
additional share of our common stock with a market value of twice the exercise
price. This prospective dilution to a potential acquirer would make
the acquisition impracticable unless the terms were improved to the satisfaction
of the Board of Directors. The existence of the plan may impede a
takeover not supported by our Board, even though such takeover may be desired by
a majority of our stockholders or may involve a premium over the prevailing
stock price.
Shares
eligible for future sale may cause the market price of our common stock to drop
significantly, even if our business is doing well.
The
potential for sales of substantial amounts of our common stock in the public
market may have a materially adverse effect on our stock price. As of
February 16, 2010, 62,590,571 shares of our common stock were freely tradable
without substantial restriction or the requirement of future registration under
the Securities Act of 1933. Also, as of that date, options to
purchase 1,271,292 shares of our common stock were outstanding, of which all
were exercisable. These options are exercisable at prices ranging
from $7.97 to $20.87 per share. In addition, restricted stock units
providing for the issuance of up to a total of 403,968 shares of our common
stock and 1,141,113 performance share awards (“PSAs”) were
outstanding. The PSAs represent the right to receive, upon settlement
of the PSAs after the completion of a three-year performance period, a number of
shares of our common stock that may be from zero to two times the number of PSAs
granted, depending on the extent to which the underlying performance criteria
have been achieved and the extent to which the PSAs have vested. As
of February 16, 2010, there were 62,777,688 shares of common stock
outstanding, which is net of 126,893 treasury shares.
We
may not always pay dividends on our common stock.
The
payment of future dividends remains at the discretion of the Board of Directors,
and will continue to depend on our earnings, capital requirements, financial
condition, and other factors. In addition, the payment of dividends
is subject to covenants in our credit facility, including a covenant regarding
the level of our current ratio of current assets to current liabilities and a
limit on the annual dividend rate that we may pay to no more than $0.25 per
share. The Board of Directors may determine in the future to reduce
the current semi-annual dividend rate of $0.05 per share, or discontinue the
payment of dividends altogether.
38
ITEM
1B. UNRESOLVED
STAFF COMMENTS
St. Mary
has no unresolved comments from the SEC staff regarding its periodic or current
reports under the Securities Exchange Act of 1934.
ITEM
3. LEGAL
PROCEEDINGS
From time
to time, we may be involved in litigation relating to claims arising out of our
operations in the normal course of business. As of the date of this report, no
legal proceedings are pending against us that we believe individually or
collectively could have a materially adverse effect upon our financial
condition, results of operations or cash flows.
ITEM
4. SUBMISSION
OF MATTERS TO A VOTE OF SECURITY HOLDERS
There
were no matters submitted to a vote of our security holders during the fourth
quarter of 2009.
ITEM
4A. EXECUTIVE
OFFICERS OF THE REGISTRANT
The
following table sets forth the names, ages and positions held by St. Mary’s
executive officers. The age of the executive officers is as of
February 16, 2010.
|
Name
|
Age
|
Position
|
|
Anthony
J. Best
|
60 |
Chief
Executive Officer and President
|
|
Javan
D. Ottoson
|
51 |
Executive
Vice President and Chief Operating Officer
|
|
A.
Wade Pursell
|
44 |
Executive
Vice President and Chief Financial Officer
|
|
Mark
D. Mueller
|
45 |
Senior
Vice President and Regional Manager
|
|
Milam
Randolph Pharo
|
57 |
Senior
Vice President and General Counsel
|
|
Paul
M. Veatch
|
43 |
Senior
Vice President and Regional Manager
|
|
Stephen
C. Pugh
|
51 |
Senior
Vice President and Regional Manager
|
|
Kenneth
J. Knott
|
45 |
Vice
President – Business Development and Land and Assistant
Secretary
|
|
Gregory
T. Leyendecker
|
52 |
Vice
President and Regional Manager
|
|
John
R. Monark
|
57 |
Vice
President – Human Resources
|
|
Lehman
E. Newton, III
|
54 |
Vice
President and Regional Manager
|
|
David
J. Whitcomb
|
47 |
Vice
President – Marketing
|
|
Dennis
A. Zubieta
|
43 |
Vice
President – Engineering and Evaluation
|
|
Mark
T. Solomon
|
41 |
Controller
|
Anthony
J. Best joined St. Mary in June 2006 as President and Chief Operating
Officer. In December 2006 Mr. Best relinquished his position as Chief
Operating Officer when Javan D. Ottoson was elected to that
office. Mr. Best was elected Chief Executive Officer of St. Mary in
February 2007. From November 2005 to June 2006, Mr. Best was
developing a business plan and securing capital commitments for a new
exploration and production entity. From 2003 to October 2005, Mr.
Best was President and Chief Executive Officer of Pure Resources, Inc., an
independent oil and natural gas exploration and production company that was a
subsidiary of Unocal, where he managed all of Unocal’s onshore U.S. assets. From
2000 to 2002, Mr. Best had an oil and gas consulting practice working with
various energy firms. From 1979 to 2000, Mr. Best was with ARCO in a variety of
positions, including a period as President - ARCO Permian, President - ARCO
Latin America, Field Manager for Prudhoe Bay and VP - External Affairs for ARCO
Alaska.
Javan D.
Ottoson joined St. Mary in December 2006 as Executive Vice President and Chief
Operating Officer. Mr. Ottoson has been in the oil and gas industry
for over 25 years. From April 2006 until he joined St. Mary in
December 2006, Mr. Ottoson was Senior Vice President – Drilling and Engineering
at Energy Partners, Ltd., an independent oil and natural gas exploration and
production company, where his responsibilities included overseeing all aspects
of its drilling and engineering functions. Mr. Ottoson managed Permian Basin
assets for Pure Resources, Inc., a Unocal subsidiary, and its successor owner,
Chevron, from July 2003 to April 2006. From April 2000 to July 2003,
Mr. Ottoson owned and operated a homebuilding company in Colorado
and
39
ran his family farm. Prior to 2000 Mr. Ottoson worked
for ARCO in management and operational roles. These roles included
President of ARCO China, Commercial Director of ARCO British, and Vice President
of Operations and Development, ARCO Permian.
A. Wade
Pursell joined St. Mary in September 2008 as Executive Vice President and Chief
Financial Officer. Mr. Pursell was Executive Vice President and Chief
Financial Officer for Helix Energy Solutions Group, Inc., a global provider of
life-of-field services and development solutions to offshore energy producers
and an oil and gas producer, from February 2007 to September
2008. From October 2000 to February 2007, he was Senior Vice
President and Chief Financial Officer of Helix. He joined Helix in
May 1997, as Vice President — Finance and Chief Accounting Officer. From
1988 through 1997 he was with Arthur Andersen LLP, lastly as an Experienced
Manager specializing in the offshore services industry.
Mark D.
Mueller joined St. Mary in September 2007 as Senior Vice
President. Mr. Mueller was appointed as the Regional Manager of the
Rocky Mountain Region effective January 1, 2008. Mr. Mueller has been
in the energy industry for over 22 years. From September 2006 to
September 2007 he was Vice President and General Manager at Samson Exploration
Ltd., an oil and gas exploration and production company that was a subsidiary of
Samson Investment Company, in Calgary, Canada, where his responsibilities
included fiscal performance, reserves, and all operational functions of the
company. From April 2005 until its sale in August 2006, Mr. Mueller
was Vice President and General Manager for Samson Canada Ltd., an oil and gas
exploration and production company that was a subsidiary of Samson Investment
Company, where he was responsible for all business units and the eventual sale
of the company. Mr. Mueller joined Samson Canada Ltd. as Project
Manager in May 2003 to build a new basin-centered gas business unit and was Vice
President from December 2003 to August 2006. Prior to joining Samson,
Mr. Mueller was West Central Alberta Engineering Manager for Northrock Resources
Ltd., a Canadian oil and gas company that was a wholly-owned subsidiary of
Unocal Corporation, in Calgary, Canada. From 1986 to 2003, Mr.
Mueller held positions of increasing responsibility in engineering and
management for Unocal throughout North America and Southeast Asia.
Milam
Randolph Pharo was appointed Senior Vice President and General Counsel in August
2008. He joined St. Mary as Vice President – Land and Assistant
Secretary in January 1996. In May 1998 he was appointed Vice
President – Land and Legal and Assistant Secretary. From 1979 until
joining St. Mary, Mr. Pharo served in private practice as an attorney
specializing in oil and gas matters.
Paul M.
Veatch was appointed Senior Vice President and Regional Manager in March
2006. Mr. Veatch joined St. Mary in April 2001 as Regional A & D
Engineer. He was Vice President – General Manager, ArkLaTex from
August 2004 to March 2006 and Manager of Engineering for the ArkLaTex region
from April 2003 to August 2004.
Stephen
C. Pugh joined St. Mary as Senior Vice President and Regional Manager of the
ArkLaTex Region in July 2007. Mr. Pugh has over 27 years of
experience in the oil and gas industry. Prior to joining St. Mary,
Mr. Pugh was Managing Director for Scotia Waterous, a global leader in oil
and gas merger and acquisition advisory services. Mr. Pugh was
responsible for new business development, managing client relationships and
providing merger and acquisition advice, including transaction execution to
clients in the energy sector. Mr. Pugh held this position from July
2006 to July 2007. Prior to joining Scotia Waterous, Mr. Pugh had
over 17 years of experience in acquisitions and divestitures, operations and
engineering with Burlington Resources, and its successor-by-merger,
ConocoPhillips. His most recent position with Burlington Resources,
Inc. and ConocoPhillips was General Manager, Engineering and Operations – Gulf
Coast, a position he held from May 2004 to June 2006. Prior to that,
he was Vice President - Acquisitions and Divestitures for Burlington Resources
Canada. He held that position from May 2000 to May
2004. Mr. Pugh began his career with Superior Oil (subsequently Mobil
Oil) in Lafayette, Louisiana, where he worked in production, drilling, and
reservoir engineering.
Gregory
T. Leyendecker was appointed Vice President and Regional Manager in July
2007. Mr. Leyendecker joined St. Mary in December 2006 as Operations
Manager for the South Texas & Gulf Coast Region in Houston. Mr.
Leyendecker has worked for 28 years in the energy industry and held various
positions with Unocal Corporation, an independent oil and natural gas
exploration and production company, from 1980 until its
40
acquisition
in 2005. During this time he was the Asset Manager for Unocal Gulf
Region USA from 2003 to June 2004 and Production and Reservoir Engineering
Technology Manager for Unocal from June 2004 to August 2005. He was
appointed Drilling and Workover Manager for the San Joaquin Valley business unit
of Chevron, as successor-by-merger of Unocal Corporation, in Bakersfield,
California in August 2005 and held this position until January 2006. Immediately
prior to joining St. Mary, Mr. Leyendecker was Vice President of Drilling
Management Services from February 2006 to November 2006 for Enventure Global
Technology, a provider of solid expandable tubular technology.
John R.
Monark was appointed Vice President – Human Resources in July
2008. Mr. Monark joined St. Mary in May of 2008 as Director of
Human Resources. Mr. Monark was Director – Human Resources for
JF Shea Corporation, a leading construction and homebuilding company, from 2004
to May 2008. He served as Vice President – Human Resources for Pameco
Corporation, a distributor of HVAC systems and equipment and refrigeration
products, from 2000 to 2004. From 1996 to 2000 he served as Vice
President – Human Resources for CH2M HILL.
Lehman E.
Newton, III joined St. Mary in December 2006 as General Manager for the Midland
office and was appointed Vice President and Regional Manager of the Permian
region in June 2007. Mr. Newton has over 28 years of experience in
engineering, operations, and business development roles in the exploration and
production industry. From November 2005 to November 2006 Mr. Newton
served as Project Manager for one of Chevron’s largest lower 48
projects. Mr. Newton joined Pure Resources in February 2003 as the
Business Development Manager and worked in that capacity until October
2005. Mr. Newton was a founding partner in Westwin Energy, an
independent Permian Basin E&P firm, from June 2000 to January
2003. Prior to that, Mr. Newton spent 21 years with ARCO in various
engineering, operations and management roles. These assignments
included Asset Manager, ARCO’s East Texas operations, Vice President, Business
Development, ARCO Permian, and Vice President of Operations and Development,
ARCO Permian.
Kenneth
J. Knott was appointed Vice President – Business Development and Land and
Assistant Secretary in August 2008. Mr. Knott joined St. Mary in
November 2000 as Senior Landman for the South Texas & Gulf Coast region in
Lafayette, LA and later assumed the position of South Texas & Gulf Coast
Regional Land Manager when the office was moved to Houston in March 2004.
Mr. Knott has worked for 22 years in the energy industry holding various Land
and Business Development positions with ARCO, Vastar Resources, and BP
Amoco. Between 1987 and 1993, Mr. Knott worked for ARCO in a land capacity
handling land and business development responsibilities in several geographic
areas, such as Permian, Mid-Continent, Michigan, and California. Upon ARCO’s
spin-off of Vastar Resources in 1993, he joined Vastar Resources as a Senior
Landman working the Gulf Coast and Gulf of Mexico regions until 1999, at which
time he assumed the role of Director of Business Development for the Gulf Coast
region. He remained in that capacity until the merger of Vastar Resources into
BP Amoco in September 2000, whereby he assumed a Senior Landman position working
the Gulf Coast region.
David J.
Whitcomb was appointed Vice President – Marketing in August 2008. Mr.
Whitcomb joined St. Mary in November 1994 as Gas Contract Analyst and was
named Assistant Vice President of Gas Marketing in October 1995. In
March 2007 his responsibilities were expanded to include oil marketing at which
time his title was changed to Assistant Vice President – Director of
Marketing. From 1991 until the time of his employment with St. Mary,
Mr. Whitcomb worked for Anderman/Smith Operating Company as a Gas Contract
Analyst during which time his primary responsibility was to resolve take-or-pay
gas contract disputes. Mr. Whitcomb began his career in the industry
in 1986 with Apache Corporation where he worked as an internal auditor for
several years and then moved into marketing where he worked as a Gas Controller
and Gas Contracts Analyst.
Dennis A.
Zubieta was appointed Vice President – Engineering and Evaluation in August
2008. Mr. Zubieta joined St. Mary in June 2000 as Corporate
A&D Engineer, assumed the role of Reservoir Engineer in February 2003, and
was appointed Reservoir Engineering Manager in August 2005. Mr. Zubieta
was employed by Burlington Resources (formerly known as Meridian Oil, Inc.) from
June 1988 to May 2000 in various operations and reservoir engineering
capacities.
41
Mark T.
Solomon was appointed Controller in January 2007. Mr. Solomon was
also appointed Acting Principal Financial Officer from April 30, 2008, to
September 8, 2008, which was during the period of time that the Company’s Chief
Financial Officer position was vacant. Mr. Solomon joined St. Mary in
1996. He served as Financial Reporting Manager from February 1999 to
September 2002, Assistant Vice President – Financial Reporting from September
2002 to May 2006 and Assistant Vice President - Assistant Controller from May
2006 to January 2007. Prior to joining St. Mary, Mr. Solomon was an
auditor with Ernst & Young.
PART
II
|
ITEM
5.
|
MARKET
FOR REGISTRANT’S COMMON EQUITY, RELATED STOCKHOLDER MATTERS AND ISSUER
PURCHASES OF EQUITY SECURITIES
|
Market
Information. St. Mary’s common stock is currently traded on
the New York Stock Exchange under the symbol SM. The range of high
and low closing prices for the quarterly periods in 2009 and 2008, as reported
by the New York Stock Exchange:
|
Quarter
Ended
|
High
|
Low
|
||||||
|
December
31, 2009
|
$ | 38.05 | $ | 29.80 | ||||
|
September
30, 2009
|
33.62 | 17.13 | ||||||
|
June
30, 2009
|
23.48 | 12.05 | ||||||
|
March
31, 2009
|
24.60 | 11.21 | ||||||
|
December
31, 2008
|
$ | 35.81 | $ | 14.76 | ||||
|
September
30, 2008
|
65.58 | 32.53 | ||||||
|
June
30, 2008
|
65.00 | 37.73 | ||||||
|
March
31, 2008
|
39.95 | 31.70 | ||||||
PERFORMANCE
GRAPH
The
following performance graph compares the cumulative return on St. Mary’s common
stock, not including dividend payments, for the period beginning December 31,
2004, and ending on December 31, 2009, with the cumulative total returns of
the Dow Jones U.S. Exploration and Production Board Index, and the Standard
& Poor’s 500 Stock Index.
COMPARE
5-YEAR CUMULATIVE TOTAL RETURN
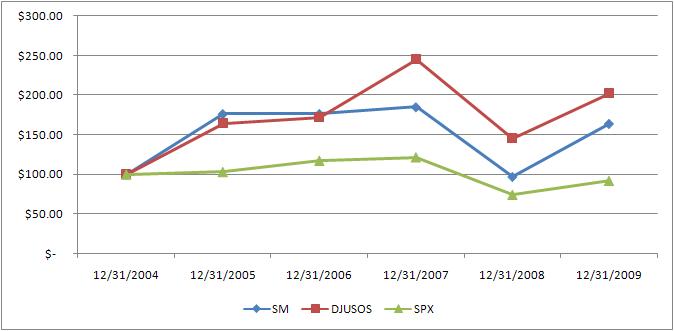
“Performance
Graph” shall be deemed to be “furnished” but not “filed” with the Securities and
Exchange Commission.
Holders. As of
February 16, 2010, the number of record holders of St. Mary’s common stock was
111. Based on inquiry, management believes that the number of
beneficial owners of our common stock is approximately 17,000.
Dividends. St.
Mary has paid cash dividends to stockholders every year since
1940. Annual dividends of $0.05 per share were paid in each of the
years 1998 through 2004. Annual dividends of $0.10 per share were
paid in 2005 through 2009. We expect that our practice of paying
dividends on our common stock will continue, although the payment of future
dividends will continue to depend on our earnings, cash flow, capital
requirements, financial condition, and other factors. In addition,
the payment of dividends is subject to covenants in our credit facility,
including the requirement that we maintain the level of our current ratio of
current assets to current liabilities and the limitation of our annual dividend
rate to no more than $0.25 per share per year. Dividends are
currently paid on a semi-annual basis. Dividends paid totaled $6.2
million in 2009 and $6.2 million in 2008.
Equity Incentive Compensation
Plan. In May 2009, the shareholders approved an amendment to
rename the 2006 Equity Incentive Compensation Plan to the Equity Incentive
Compensation Plan (the “Equity Plan”).
Restricted Shares. St. Mary has no restricted shares outstanding as of
December 31, 2009, aside from Rule 144 restrictions on shares
for insiders, shares are subject to transfer restrictions under the provisions
of the Employee Stock Purchase Plan, and shares issued to directors under the
Equity Plan.
Equity Compensation
Plans. St. Mary has the Equity Plan under which options and
shares of St. Mary common stock are authorized for grant or issuance as
compensation to eligible employees, consultants, and members of the Board of
Directors. Our stockholders have approved this plan. See
Note 7 – Compensation Plans in the Notes to Consolidated Financial Statements
included in Part IV, Item 15 of this report for further information about the
material terms of our equity compensation plans. The following table
is a summary of the shares of common stock authorized for issuance under the
equity compensation plans as of December 31, 2009:
|
(a)
|
(b)
|
(c)
|
||||||||||
|
Plan
category
|
Number
of securities to be issued upon exercise of outstanding options, warrants,
and rights
|
Weighted-average
exercise price of outstanding options, warrants, and
rights
|
Number
of securities remaining available for future issuance under equity
compensation plans (excluding securities reflected in column
(a))
|
|||||||||
|
Equity
compensation plans approved by security holders:
|
||||||||||||
|
Equity
Incentive Compensation Plan
|
||||||||||||
|
Stock
options and incentive stock options (1)
|
1,274,920 | $ | 13.31 | - | ||||||||
|
Restricted
stock (1)
|
408,356 | - | - | |||||||||
|
Performance
share awards (1)(3)
|
1,145,871 | $ | 32.52 | 1,771,009 | ||||||||
|
Total
for Equity Incentive Compensation Plan
|
2,829,147 | $ | 22.40 | 1,771,009 | ||||||||
|
Employee
Stock Purchase Plan (2)
|
- | - | 1,468,275 | |||||||||
|
Equity
compensation plans not approved by security holders
|
- | - | - | |||||||||
|
Total
for all plans
|
2,829,147 | $ | 22.40 | 3,239,284 | ||||||||
|
(1)
|
In
May 2006 the stockholders approved the Equity Plan to authorize the
issuance of restricted stock, restricted stock units, non-qualified stock
options, incentive stock options, stock appreciation rights, and
stock-based awards to key employees, consultants, and members of the Board
of Directors of St. Mary or any affiliate of St. Mary. The
Equity Plan serves as the successor to the St. Mary Land &
Exploration Company Stock Option Plan, the St. Mary Land & Exploration
Company Incentive Stock Option Plan, the St. Mary Land & Exploration
Company Restricted Stock Plan, and the St. Mary Land & Exploration
Company Non-Employee Director Stock Compensation Plan (collectively
referred to as the “Predecessor Plans”). All grants of equity
are now made out of the Equity Plan, and no further grants will be made
under the Predecessor Plans. Each outstanding award under a
Predecessor Plan immediately prior to the effective date of the Equity
Plan continues to be governed solely by the terms and conditions of the
instruments evidencing such grants or issuances. Our Board of
Directors approved amendments to the Equity Plan on
March 26, 2008, and the amended plan was approved by
stockholders at our annual stockholders’ meeting
May 21, 2008. Our Board of Directors approved
additional amendments to the Equity Plan on March 26, 2009, and
the amendments were approved by stockholders at our annual stockholders’
meeting on May 20, 2009. Awards granted in 2009,
2008, and 2007 under the Equity Plan were 1,016,931, 932,767, and 135,138,
respectively.
|
|
(2)
|
Under
the St. Mary Land & Exploration Company Employee Stock Purchase Plan
(the “ESPP”), eligible employees may purchase shares of our common stock
through payroll deductions of up to 15 percent of their eligible
compensation. The purchase price of the stock is 85 percent of
the lower of the fair market value of the stock on the first or last day
of the six-month offering period, and shares issued under the ESPP through
December 31, 2009, are restricted for a period of 18 months from
the date issued. Effective January 1, 2010, shares
issued under the ESPP will be restricted for a period six months from the
date issued. The ESPP is intended to qualify under Section 423
of the Internal Revenue Code. Shares issued under the ESPP
totaled 86,308, 45,228, and 29,534 in 2009, 2008, and 2007,
respectively.
|
|
(3)
|
The
PSAs represent the right to receive, upon settlement of the PSAs after the
completion of a three-year performance measurement period, a number of
shares of our common stock that may be from zero to two times the number
of PSAs granted, depending on the extent to which the underlying
performance criteria have been achieved and the extent to which the PSAs
have vested. The performance criteria for the PSAs are based on
a combination of our cumulative Total Shareholder Return (“TSR”) for the
performance period and the relative measure of our TSR compared with the
TSR an index comprised of certain peer companies for the performance
period. The current outstanding PSAs were granted on
August 1, 2009, and 2008, and utilize a three-year performance
measurement period which began on July 1, 2009, and 2008,
respectively. On July 1, 2009, the market value per share of our
common
|
|
|
stock
was $21.15, and on the date of grant the market value per share of our
common stock was $23.87. On July 1, 2008, the market
value per share of our common stock was $62.51, and on the date of grant
the market value per share of our common stock was $43.11. The
PSAs do not have an exercise price associated with them, but rather the
$32.52 price shown in the above table represents the weighted-average per
share fair value as of December 31, 2009, calculated pursuant to
ASC Topic 718, which is presented in order to provide additional
information regarding the potential dilutive effect of the PSAs as of
December 31, 2009, in view of the share price level at the
beginning of the performance period which will be utilized to compute the
TSR measurements for determination of the number of shares to be issued
upon settlement of the PSAs after completion of the three-year performance
measurement period.
|
46
Issuer Purchases of Equity
Securities. The following table provides information about
purchases by the Company or “affiliated purchaser” (as defined in Rule
10b-18(a)(3) under the Exchange Act) during the quarters and year ended
December 31, 2009, of shares of the Company’s common stock, which is
the sole class of equity securities registered by the Company pursuant to
Section 12 of the Exchange Act.
|
PURCHASES
OF EQUITY SECURITIES BY ISSUER AND AFFILIATED PURCHASERS
|
|||||||||
|
Total
Number of Shares Purchased
(1)(2)(3)(4)
|
Average
Price Paid per Share
|
Total
Number of Shares Purchased as Part of Publicly Announced
Program
|
Maximum
Number of Shares that May Yet be Purchased Under the Program(5)
|
||||||
|
January
1, 2009 –
March 31, 2009
|
58,688 | $ | 13.60 | -0- | 3,072,184 | ||||
|
April
1, 2009 -
June 30, 2009
|
341 | $ | 18.69 | -0- | 3,072,184 | ||||
|
July
1, 2009 -
September 30,
2009
|
412 | $ | 24.86 | -0- | 3,072,184 | ||||
|
October
1, 2009 -
October 31,
2009
|
30 | $ | 35.36 | -0- | 3,072,184 | ||||
|
November
1, 2009 -
November 30,
2009
|
86 | $ | 34.10 | -0- | 3,072,184 | ||||
|
December
1, 2009 -
December 31,
2009
|
21,391 | $ | 35.34 | -0- | 3,072,184 | ||||
|
Total
October 1, 2009 -
December 31,
2009
|
21,507 | $ | 35.33 | -0- | 3,072,184 | ||||
|
Total
|
80,948 | $ | 19.45 | -0- | 3,072,184 | ||||
|
(1)
|
Includes
a total of 6,500 shares purchased by Anthony J. Best, St. Mary’s President
and Chief Executive Officer, in open market transactions that were not
made pursuant to our stock repurchase
program.
|
|
(2)
|
Includes
a total of 5,000 shares purchased by A. Wade Pursell, St. Mary’s Executive
Vice President and Chief Financial Officer, in open market transactions
that were not made pursuant to our stock repurchase
program.
|
|
(3)
|
Includes
a total of 10,000 shares purchased by William D.
Sullivan, a Director of St. Mary, in open market transactions
that were not made pursuant to our stock repurchase
program.
|
|
(4)
|
Includes
59,448 shares withheld (under the terms of grants under the Equity
Incentive Compensation Plan) to offset tax withholding obligations that
occur upon the delivery of outstanding shares underlying restricted stock
units that were not made pursuant to our stock repurchase
program.
|
|
(5)
|
In
July 2006 our Board of Directors approved an increase in the number of
shares that may be repurchased under the original August 1998
authorization to 6,000,000 as of the effective date of the
resolution. Accordingly, as of the date of this filing, we have
Board authorization to repurchase 3,072,184 shares of common stock on a
prospective basis. The shares may be repurchased from time to
time in open market transactions or privately negotiated transactions,
subject to market conditions and other factors, including certain
provisions of St. Mary’s existing bank credit facility agreement and
compliance with securities laws. Stock repurchases may be
funded with existing cash balances, internal cash flow, and borrowings
under St. Mary’s bank credit facility. The stock repurchase program may be
suspended or discontinued at any
time.
|
|
The
payment of dividends and stock repurchases are subject to covenants in our
bank credit facility, including the requirement that we maintain certain
levels of stockholders’ equity and the limitation that does not allow our
annual dividend rate to exceed $0.25 per
share.
|
ITEM
6. SELECTED
FINANCIAL DATA
The
following table sets forth supplemental selected financial and operating data
for St. Mary as of the dates and periods indicated. The financial
data for each of the five years presented were derived from the consolidated
financial statements of St. Mary. The following data should be read
in conjunction with “Management’s Discussion and Analysis of Financial Condition
and Results of Operations,” which includes a discussion of factors materially
affecting the comparability of the information presented, and in conjunction
with St. Mary’s consolidated financial statements included in this
report.
|
Years
Ended December 31,
|
|||||||||||||||
|
2009
|
2008
(1)
|
2007(1) | 2006 | 2005 | |||||||||||
|
(In
thousands, except per share data)
|
|||||||||||||||
|
Total
operating revenues
|
$ | 832,201 | $ | 1,301,301 | $ | 990,094 | $ | 787,701 | $ | 739,590 | |||||
|
Net
income (loss)
|
$ | (99,370 | ) | $ | 87,348 | $ | 187,098 | $ | 190,015 | $ | 151,936 | ||||
|
Net
income (loss) per share:
|
|||||||||||||||
|
Basic
|
$ | (1.59 | ) | $ | 1.40 | $ | 3.02 | $ | 3.38 | $ | 2.67 | ||||
|
Diluted
|
$ | (1.59 | ) | $ | 1.38 | $ | 2.90 | $ | 2.94 | $ | 2.33 | ||||
|
Total
assets at year end
|
$ | 2,360,936 | $ | 2,697,247 | $ | 2,572,942 | $ | 1,899,097 | $ | 1,268,747 | |||||
|
Long-term
obligations:
|
|||||||||||||||
|
Line
of credit
|
$ | 188,000 | $ | 300,000 | $ | 285,000 | $ | 334,000 | $ | - | |||||
|
Senior
convertible notes, net of debt discount
|
$ | 266,902 | $ | 258,713 | $ | 251,070 | $ | 99,980 | $ | 99,885 | |||||
|
Cash
dividends declared and paid per common share
|
$ | 0.10 | $ | 0.10 | $ | 0.10 | $ | 0.10 | $ | 0.10 | |||||
|
(1)
|
As
Adjusted, see Note 5 to the Consolidated Financial
Statements
|
|
Supplemental
Selected Financial and Operations Data
|
|||||||||||||||
|
Years
Ended December 31,
|
|||||||||||||||
|
2009
|
2008
|
2007
|
2006
|
2005
|
|||||||||||
|
(In
thousands, except per share data)
|
|||||||||||||||
|
Balance
Sheet Data
|
|||||||||||||||
|
Total
working capital (deficit)
|
$ | (87,625 | ) | $ | 15,193 | $ | (92,604 | ) | $ | 22,870 | $ | 4,937 | |||
|
Total
stockholders’ equity
|
$ | 973,570 | $ | 1,162,509 | $ | 902,574 | $ | 743,374 | $ | 569,320 | |||||
|
Weighted-average
shares outstanding
|
|||||||||||||||
|
Basic
|
62,457 | 62,243 | 61,852 | 56,291 | 56,907 | ||||||||||
|
Diluted
|
62,457 | 63,133 | 64,850 | 65,962 | 66,894 | ||||||||||
|
Reserves
|
|||||||||||||||
|
Oil
(MMBbl)
|
53.8 | 51.4 | 78.8 | 74.2 | 62.9 | ||||||||||
|
Gas
(Mcf)
|
449.5 | 557.4 | 613.5 | 482.5 | 417.1 | ||||||||||
|
MCFE
|
772.2 | 865.5 | 1,086.5 | 927.6 | 794.5 | ||||||||||
|
Production
and Operational:
|
|||||||||||||||
|
Oil
and gas production revenues, including hedging
|
$ | 756,601 | $ | 1,158,304 | $ | 936,577 | $ | 758,913 | $ | 711,005 | |||||
|
Oil
and gas production expenses
|
$ | 206,800 | $ | 271,355 | $ | 218,208 | $ | 176,590 | $ | 142,873 | |||||
|
DD&A
|
$ | 304,201 | $ | 314,330 | $ | 227,596 | $ | 154,522 | $ | 132,758 | |||||
|
General
and administrative
|
$ | 76,036 | $ | 79,503 | $ | 60,149 | $ | 38,873 | $ | 32,756 | |||||
|
Production
Volumes:
|
|||||||||||||||
|
Oil
(MMBbl)
|
6.3 | 6.6 | 6.9 | 6.1 | 5.9 | ||||||||||
|
Gas
(Bcf)
|
71.1 | 74.9 | 66.1 | 56.4 | 51.8 | ||||||||||
|
BCFE
|
109.1 | 114.6 | 107.5 | 92.8 | 87.4 | ||||||||||
|
Realized
price – pre hedging:
|
|||||||||||||||
|
Per
Bbl
|
$ | 54.40 | $ | 92.99 | $ | 67.56 | $ | 59.33 | $ | 53.18 | |||||
|
Per
Mcf
|
$ | 3.82 | $ | 8.60 | $ | 6.74 | $ | 6.58 | $ | 8.08 | |||||
|
Realized
price – net of hedging:
|
|||||||||||||||
|
Per
Bbl
|
$ | 56.74 | $ | 75.59 | $ | 62.60 | $ | 56.60 | $ | 50.93 | |||||
|
Per
Mcf
|
$ | 5.59 | $ | 8.79 | $ | 7.63 | $ | 7.37 | $ | 7.90 | |||||
|
Expense
per MCFE:
|
|||||||||||||||
|
LOE
|
$ | 1.33 | $ | 1.46 | $ | 1.31 | $ | 1.25 | $ | 0.99 | |||||
|
Transportation
|
$ | 0.19 | $ | 0.19 | $ | 0.14 | $ | 0.12 | $ | 0.09 | |||||
|
Production
taxes
|
$ | 0.37 | $ | 0.71 | $ | 0.58 | $ | 0.54 | $ | 0.56 | |||||
|
DD&A
|
$ | 2.79 | $ | 2.74 | $ | 2.12 | $ | 1.67 | $ | 1.52 | |||||
|
General
and administrative
|
$ | 0.70 | $ | 0.69 | $ | 0.56 | $ | 0.42 | $ | 0.37 | |||||
|
Cash
Flow:
|
|||||||||||||||
|
Provided
by operations
|
$ | 436,106 | $ | 679,190 | $ | 632,054 | $ | 467,700 | $ | 409,379 | |||||
|
Used
in investing
|
$ | (304,092 | ) | $ | (673,754 | ) | $ | (805,134 | ) | $ | (724,719 | ) | $ | (339,779 | ) |
|
Provided
by (used in) financing
|
$ | (127,496 | ) | $ | (42,815 | ) | $ | 215,126 | $ | 243,558 | $ | (61,093 | ) | ||
ITEM
7. MANAGEMENT’S
DISCUSSION AND ANALYSIS OF FINANCIAL CONDITION AND RESULTS OF
OPERATION
This
discussion includes forward-looking statements. Please refer to
“Cautionary Information about Forward-Looking Statements” in Part I, Items 1 and
2 of this Form 10-K for important information about these types of
statements.
Overview
of the Company
General
Overview
We are an
independent energy company focused on the development, exploration,
exploitation, acquisition, and production of natural gas and crude oil in North
America. We generate nearly all our revenues and cash flows from the
sale of produced natural gas and crude oil. Our oil and gas reserves
and operations are concentrated primarily in the Rocky Mountain Williston Basin;
the Mid-Continent Anadarko and Arkoma basins; the Permian Basin; the productive
formations of East Texas and North Louisiana; north central Pennsylvania; the
Maverick Basin in South Texas; and the onshore Gulf Coast and offshore Gulf of
Mexico. We have developed a balanced and diverse portfolio of proved
reserves, development drilling opportunities, and unconventional resource
prospects.
Our
mission is to deliver outstanding net asset value per share growth to our
investors via attractive oil and gas investments. Historically, we
have relied on a strategy of growing through niche acquisitions focused in the
continental United States. Over the last few years, we have shifted
our strategy to focus more on capturing potential resource plays earlier and at
a lower cost. We believe that this shift will allow for more stable
and predictable production and proved reserves growth. Going forward,
we will focus on continuing to acquire significant leasehold positions in
existing and emerging resource plays in North America.
In 2009
we had the following financial and operational results:
|
·
|
Average
daily gas production of 194.8 MMcf was down five percent from
2008. Average daily oil production of 17.3 MBbl was down four
percent from 2008. Average total equivalent daily production
was 298.8 MMCFE, which was down five percent from
2008.
|
|
·
|
Estimated
proved reserves of 53.8 MMBbls of oil and 449.5 Bcf of natural gas, or
772.2 BCFE, as of December 31, 2009. This was a decrease of 11
percent from year-end 2008 proved reserves of 865.5 BCFE and reflects
the divestiture of 44.2 BCFE of non-strategic properties, 61.6 BCFE in net
downward performance revisions, and 12.0 BCFE of net positive price
revisions. We had reserve additions from extensions and
discoveries and infill drilling of 109.6
BCFE.
|
|
·
|
We
recorded a net loss of $99.4 million and diluted loss per share of $1.59
for the year ended December 31, 2009. This compares
with net income of $87.3 million, or $1.38 per diluted share, for the year
ended December 31, 2008.
|
|
·
|
Cash
flow from operating activities of $436.1 million, a decrease of 36 percent
from 2008.
|
|
·
|
Costs
incurred for oil and gas producing activities for the year ended
December 31, 2009, were $419.0 million, compared with $857.7
million for the same period in
2008.
|
Our
operations are generally funded first through cash flows from operating
activities and then through borrowings under our existing credit
facility. The divestiture of non-core assets is also a potential
source of liquidity. Acquisitions may be funded with proceeds from
sales of public or private debt and equity, borrowings under our existing
facility, property sales, and cash flow from operating activities. In
2009 we
invested $377.2 million for development and exploration and $41.7 million
for leasehold.
50
A major
determination of the value of our company is the value of our proved
reserves. At year-end 2009 we had proved reserves of 772.2 BCFE of
which 58 percent were natural gas and 82 percent were characterized as proved
developed. There were a number of changes that took effect in 2009
impacting the calculation of our year-end proved reserves. The SEC
instituted a number of revisions to its existing oil and gas reporting
requirements. A key revision to the rules pertains to the use of
12-month average pricing as opposed to year-end pricing in estimating proved
reserves. The prices used in the calculation of proved reserve
estimates as of December 31, 2009, were $61.18 per Bbl and $3.87 per
MMBTU for oil and natural gas, respectively. These prices were 23
percent and 33 percent lower, respectively, than the year-end prices that would
have been used under the SEC’s previous methodology. Additional
changes in the SEC rules provide for the use of new technology to determine
proved reserves and the ability to include nontraditional resources in proved
reserves. In addition to these regulatory changes, in 2009 we began
recording estimates of proved reserve volumes for properties we believe are
reasonably certain to generate positive net cash flows on an undiscounted basis,
which we have the intent to drill, and which meet our internal economic criteria
for drilling even though they may have a negative PV-10
value. Previously, we booked proved reserve volumes if the
properties showed a positive PV-10 value, we had the intent to drill, and the
wells met our economic criteria.
We added
109.6 BCFE from our drilling program during the year, with our emerging resource
play in the Eagle Ford shale in the Maverick Basin in South Texas contributing a
significant portion of those additions. Our programs targeting the
Woodford shale in eastern Oklahoma and the Bakken/Three Forks formations in the
North Dakota portion of the Williston Basin also added meaningful additions in
2009. We sold 44.2 BCFE of proved reserves during the year, with
roughly 90 percent of those relating to the divestiture of our coalbed methane
project at Hanging Woman Basin along the border of Montana and
Wyoming. The balance of the divested properties sold in 2009 was
non-strategic assets, which were spread across the company. We had a downward
net revision of 49.6 BCFE that consisted of 61.6 BCFE in net downward
engineering revisions and a net positive pricing revision of 12.0
BCFE. The largest portion of the performance revision relates to
producing properties in our Wolfberry tight oil program in the Permian Basin in
West Texas. Well performance data collected during 2009 for Wolfberry
assets at Sweetie Peck and Halff East indicated these assets are underperforming
our year-end 2008 decline forecasts. Accordingly, we removed roughly
37 BCFE from proved reserves in the Permian region, primarily related to the
Wolfberry tight oil program. We believe that a significant portion of
these reserves, while not meeting the criteria to be booked as proved reserves
at year-end, are likely to be produced eventually. We also saw a
downward performance revision of approximately 12 BCFE related to certain Cotton
Valley assets in our ArkLaTex region. Due to the pricing methodology
changes noted above, we recognized positive price revisions in our oil-weighted
Rocky Mountain and Permian regions that offset negative price revisions we
recognized in the natural gas weighted Mid-Continent, ArkLaTex, and South Texas
& Gulf Coast regions. Under the previous methodology of using
year-end pricing for the determination of proved reserves, we would have had an
increase of four percent in proved reserves to approximately 897
BCFE.
The PV-10
value of our proved reserves was $1.3 billion as of December 31,
2009. The after tax value of $1.0 billion as represented by the
standardized measure calculation is presented in Note 16 – Disclosures about Oil
and Gas Producing Activities of Part IV, Item 15 of
this report. A reconciliation between these two amounts is shown
under Reserves in Part I, Items 1 and 2 of this report.
Reserve
Replacement, Finding Costs, and Growth
Like all
oil and gas exploration and production companies, we face the challenge of
growing oil and natural gas reserves. An exploration and production
company depletes part of its asset base with each unit of oil or gas it
produces. Our future growth will depend on our ability to
economically add reserves in excess of production.
The
following table provides various reserve replacement and finding cost metrics
for the year ended December 31, 2009:
|
Reserve
Replacement Percentage
|
Finding
Cost per MCFE
|
|||||||||
|
Excluding
sales
|
Including
sales
|
Excluding
sales
|
Including
sales
|
|||||||
|
Drilling,
excluding revisions
|
100% | 60% | $ | 3.44 | $ | 5.77 | ||||
|
Drilling,
including revisions
|
55% | 14% | $ | 6.29 | $ | 23.91 | ||||
|
Drilling
and acquisitions, excluding revisions
|
100% | 60% | $ | 3.44 | $ | 5.77 | ||||
|
Drilling
and acquisitions, including revisions
|
55% | 14% | $ | 6.29 | $ | 23.92 | ||||
|
Acquisitions
|
N/M | N/M | N/M | N/M | ||||||
|
All-in
|
55% | 14% | $ | 6.99 | $ | 26.56 | ||||
The
following table provides three-year average reserve replacement and finding cost
metrics for the years ended December 31, 2009, 2008, and 2007:
|
Reserve
Replacement Percentage
|
Finding
Cost per MCFE
|
|||||||||
|
Excluding
sales
|
Including
sales
|
Excluding
sales
|
Including
sales
|
|||||||
|
Drilling,
excluding revisions
|
124% | 92% | $ | 4.27 | $ | 5.77 | ||||
|
Drilling,
including revisions
|
48% | 16% | $ | 11.07 | $ | 33.90 | ||||
|
Drilling
and acquisitions, excluding revisions
|
162% | 129% | $ | 3.68 | $ | 4.60 | ||||
|
Drilling
and acquisitions, including revisions
|
85% | 53% | $ | 6.97 | $ | 11.22 | ||||
|
Acquisitions
|
37% | 5% | $ | 1.72 | $ | 12.60 | ||||
|
All-in
|
85% | 53% | $ | 7.79 | $ | 12.53 | ||||
Our
challenge is to grow net asset value per share, which we believe drives
appreciation in our stock price over the long term. To accomplish
this, we believe it is important to economically replace annual production with
new reserves. We believe annual reserve replacement percentage and
finding cost amounts are important analytical measures that are widely used by
investors and industry peers in evaluating and comparing the performance of oil
and gas companies. While single-year measurements have some meaning
in terms of a trend, we believe that aberrations, causing both relatively good
and bad results, will occur over short intervals of time. The
information used to calculate the above reserve replacement and finding cost
metrics is included in Note 15 – Oil and Gas Activities and Note 16 –
Disclosures about Oil and Gas Producing Activities of the Notes to Consolidated
Financial Statements included in part IV, Item 15 of this report. For
additional information about these metrics, see the reserve replacement and
finding cost terms in the Glossary at the end of Part I, Items 1 and 2 of this
report.
Financial
Standing and Liquidity
During
and subsequent to the third quarter of 2008, specific issues related to the
financial sector rippled through the broader economy. The failure or
takeovers of several large financial institutions adversely impacted the wider
equity, debt, and credit markets. Financial strength and liquidity
became increasingly important as investors considered the ability of companies
to fund their planned levels of activity and to service their debt
obligations. In addition, fears of prolonged weakness in the global
economy leading to anemic energy demand resulted in a significant decline in oil
and natural gas prices. As a result of these events, we entered 2009
with a business plan designed to operate within our operating cash
flow. We have maintained a disciplined approach with our capital
investments during the year, which, combined with higher operating cash flows
than we anticipated originally, have allowed us to maintain our strong financial
position and reduce borrowings under our credit facility. Our
exploration and development program at the beginning of 2009 was designed to
stay within generated cash flow. We met this goal in
2009. We continue to believe we have adequate liquidity available to
us through our credit facility as discussed below under the caption Overview of
Liquidity and Capital Resources.
Oil
and Gas Prices
Our
financial condition and the results of our operations are significantly affected
by oil and natural gas commodity prices, which can fluctuate
dramatically. We sell a majority of our natural gas under contracts
that use first of the month index pricing, which means that gas produced in a
given month is sold at the first of the month price regardless of the spot price
on the day the gas is produced. Our crude oil is sold using contracts
that pay us either the average of the NYMEX West Texas Intermediate daily
settlement or the average of alternative posted prices for the periods in which
the crude oil is produced, adjusted for quality, transportation, and location
differentials. The following table is a summary of commodity price
data for the years ended December 31, 2009, 2008, and 2007.
|
For
the Years Ended December 31,
|
|||||||||
|
2009
|
2008
|
2007
|
|||||||
|
Crude Oil (per Bbl):
|
|||||||||
|
Average
NYMEX WTI spot price
|
$ | 61.99 | $ | 99.92 | $ | 72.23 | |||
|
Realized
price, before the effects of hedging
|
$ | 54.40 | $ | 92.99 | $ | 67.56 | |||
|
Net
realized price, including the effects of hedging
|
$ | 56.74 | $ | 75.59 | $ | 62.60 | |||
|
Natural Gas (per Mcf):
|
|||||||||
|
Average
NYMEX Henry Hub spot price
|
$ | 3.94 | $ | 8.89 | $ | 6.97 | |||
|
Realized
price, before the effects of hedging
|
$ | 3.82 | $ | 8.60 | $ | 6.74 | |||
|
Net
realized price, including the effects of hedging
|
$ | 5.59 | $ | 8.79 | $ | 7.63 | |||
We expect
future prices for oil and natural gas to be volatile. The comparative
strength of the U.S. Dollar will likely continue to impact crude prices just as
changes in domestic industrial demand will continue to impact the price of
natural gas. The 12-month strip prices for NYMEX WTI crude and NYMEX
Henry Hub gas as of December 31, 2009, were $82.15 per Bbl and $5.87 per MMBTU,
respectively; comparable prices as of February 16, 2010, were $79.43 per Bbl and
$5.76 per MMBTU, respectively.
While
changes in quoted NYMEX oil and natural gas prices are generally used as a basis
for comparison within our industry, the price we receive for oil and natural gas
is affected by quality, energy content, location, and transportation
differentials for these products. We refer to this price as our
realized price, which excludes the effects of hedging. Our realized
price is further impacted by the results of our hedging arrangements that are
settled in the respective periods. We refer to this price as our net
realized price. For the year ended December 31, 2009, our net natural
gas price realization was positively impacted by $125.9 million of realized
hedge settlements and our net oil price realization was positively impacted by
$14.8 million of realized hedge settlements.
53
Hedging
Activities
Hedging
is an important part of our financial risk management program. We
have a Board-authorized financial risk management policy that governs our
practices related to hedging. The amount of production we hedge is
driven by the amount of debt on our consolidated balance sheet and the level of
capital commitments and long-term obligations we have in place. In
the case of a significant acquisition of producing properties, we will consider
hedging a portion of the acquired production in order to protect the economics
assumed in the acquisition. With the hedges we have in place, we
believe we have established a base cash flow stream for our future operations,
and our use of collars for a portion of the hedges allows us to participate in
upward movements in oil and gas prices while also setting a price floor for a
portion of our production. Please see Note 10 – Derivative Financial
Instruments of Part IV, Item 15 of this report for additional information
regarding our oil and gas hedges, and see the caption, Summary of Oil and Gas Production
Hedges in Place, later in this section.
We
attempt to qualify our oil and gas derivative instruments as cash flow hedges
for accounting purposes under Accounting Standards Codification Topic
815. Changes in the value of our hedge positions are primarily
reflected in our consolidated balance sheets. A portion of the change
in the value of our hedge positions is recognized in our consolidated statements
of operations due to the hedges being partially ineffective. We
recognized a $20.5 million in non-cash derivative loss for the year ended
December 31, 2009.
The U.S.
Congress is currently considering recent proposals to increase the regulatory
oversight of the over-the-counter derivatives markets in order to promote more
transparency in those markets. Although we cannot predict the
ultimate outcome of these proposals, new regulations in this area may result in
increased costs and cash collateral requirements for the types of oil and gas
derivative instruments we use to hedge and otherwise manage our financial risks
related to swings in oil and gas commodity prices.
2009
Highlights
Developments in emerging resource
plays. During 2008, the Haynesville shale, the Eagle Ford
shale, and the Marcellus shale resource plays emerged as significant new sources
of gas supply for the exploration and production industry. We have
exposure to each of these plays that, if successful, could provide for
significant future organic growth in reserves and production. The
Haynesville shale emerged early in 2008 in northern Louisiana and eastern Texas
and quickly became the most active resource play in the country. Our
position was built as a result of prior leasing activity targeting the James
Lime and Cotton Valley formations. Our Eagle Ford shale position in
the Maverick Basin in South Texas was built from 2007 through 2009 through a
combination of property acquisitions, leasing activity, and participation in a
joint venture with industry partners. Late in 2008 we entered into
arrangements that allow us to earn or purchase acreage in the Marcellus shale in
north central Pennsylvania. During 2009 we worked to advance our
understanding of these plays and move them closer to development
mode. The most progress was made in our Eagle Ford shale program in
South Texas. We successfully tested seven wells across our operated
acreage position during the second half of 2009. The early results
from this program suggest wells at the southern end of our acreage will produce
drier gas while wells drilled further north will produce higher BTU-content gas
and some condensate. We are currently booking only the parallel
offsets to producing wells as proved undeveloped locations. As a
result, we believe meaningful potential exists to grow proved reserves on our
operated acreage with our planned drilling activity for 2010 and increased
understanding of how reliable technology will allow the play to be
developed. On our joint venture acreage in Dimmit County, Texas, we
believe these wells will produce even higher amounts of condensate and oil
compared to our operated position. In the Haynesville shale program
in the ArkLaTex region, a number of successful wells were drilled around our
acreage position in East Texas in 2009. We began horizontal drilling
early in 2010 when our 3D seismic analysis was completed. In our
Marcellus shale program in north central Pennsylvania, we drilled and completed
our first two horizontal wells during 2009. Initial indications from
the well tests were encouraging. The gathering line that will connect
these wells to sales is in the process of being constructed.
Shift toward
oil-weighted projects. As a result of continued downward
pressure on natural gas prices and an increase in oil prices, we began shifting
capital investment dollars toward oil-weighted projects during the third
54
quarter. We
saw an increase in activity in our Permian and Rocky Mountain regions as a
result of this shift in capital.
Borrowing base on credit facility
maintained. On September 29, 2009, the borrowing base on our
credit facility was redetermined and maintained by our bank group at a value of
$900 million.
Impairments. We
recognized a pre-tax non-cash impairment of proved properties in the amount of
$174.8 million in 2009. There was an impairment of proved properties
in the amount of $302.2 million in 2008. A significant decrease in
the market price for natural gas, including differentials in effect at March 31,
2009, caused the majority of the non-cash impairment. The largest
portion of the change in 2009 was $97.3 million related to assets located in the
Mid-Continent region which were impacted by the lower March 31, 2009, prices
referred to above as well as wider than normal differentials. The
ArkLaTex region was impacted by a $20.4 million impairment related to downward
pricing and engineering revisions. We incurred a $14.0 million
impairment on proved properties related to the write-down of certain assets
located in the Gulf of Mexico for which we are relinquishing our ownership
interests.
During
the year, we abandoned or impaired $45.4 million related to unproved
properties. The largest specific components of the 2009 impairment
and abandonment related to the Floyd Shale acreage located in Mississippi and
acreage in Oklahoma. The remaining write-offs were related to acreage
we believe we will not be able to hold due to current allocations of capital and
to acreage that we do not believe will be prospective.
Lastly,
we incurred inventory write-downs of $14.2 million for the year ended
December 31, 2009 in order to present inventory at the lower of cost
or market value. The market value of tubular goods and other
inventory items that were purchased in 2008 when prices for these goods were
considerably higher declined over the course of 2009 as a result of lower levels
of activity throughout the industry.
Divestitures. We continue to optimize our portfolio of assets as
part of our overall strategy to focus on concentrated resource
plays. As part of this strategy, on December 18, 2009, we completed
the divestiture of our non-strategic coalbed methane project at Hanging Woman
Basin located in the Rocky Mountain region. Total cash received was
$23.3 million, which is subject to customary post-closing
adjustments. During 2009 we recorded an $11.4 million gain on
divestiture activity, which included the gain from the Hanging Woman Basin
divestiture, as well as other smaller divestitures.
Production
results. The table below details the regional breakdown of our
2009 production.
|
ArkLaTex
|
Mid-Continent
|
South
Texas & Gulf Coast
|
Permian
|
Rocky
Mountain
|
Total(1)
|
|||||||
|
2009
Production:
|
||||||||||||
|
Oil
(MBbl)
|
124 | 274 | 407 | 1,845 | 3,678 | 6,328 | ||||||
|
Gas
(MMcf)
|
14,167 | 34,380 | 7,255 | 4,075 | 11,229 | 71,106 | ||||||
|
Equivalent
(MMCFE)
|
14,912 | 36,026 | 9,696 | 15,148 | 33,295 | 109,077 | ||||||
|
Avg.
Daily Equivalents (MMCFE/per day)
|
40.8 | 98.7 | 26.6 | 41.5 | 91.2 | 298.8 | ||||||
|
Relative
percentage
|
14% | 33% | 9% | 14% | 30% | 100% | ||||||
(1)
Totals may not add due to rounding
In 2009
our production and oil and gas production revenues have outperformed our initial
budget for 2009 due to stronger than anticipated production results from our
Mid-Continent and Permian regions. Please
refer to Comparison of Financial Results and
Trends between 2009 and 2008 below for additional
discussion on production.
55
Net Profits
Plan. For the year ended December 31, 2009, the
change in the value of this liability resulted in a non-cash benefit of $7.1
million compared with a $34.0 million benefit for the same period in
2008. Decreases in oil and gas commodity prices have decreased the
estimated liability for the future amounts to be paid to plan
participants. This liability is a significant management
estimate. Adjustments to the liability are subject to estimation and
may change dramatically from period to period based on assumptions used for
production rates, reserve quantities, commodity pricing, discount rates, tax
rates, and production costs.
Payments
made from the Net Profits Plan have been expensed as compensation costs in the
amounts of $19.9 million, $36.3 million, and $31.9 million for the years ended
December 31, 2009, 2008, and 2007, respectively. Additionally, we
accrued cash payments under the Net Profits Plan of $724,000 for the year ended
December 31, 2009, as a result of sales proceeds during the fourth quarter of
2009. For the year ended December 31, 2008, we accrued
for cash payments under the Net Profits Plan of $15.1 million as a result
of sales proceeds from the Abraxas and Greater Green River Basin
divestitures. These cash payments are accounted for as a reduction in
the gain (loss) on divestiture activity in the accompanying consolidated
statements of operations. There were no significant cash payments
made or accrued for under the Net Profits Plan as a result of divestitures
during 2007.
The
recurring cash payments we make are dependent on actual production, realized
prices, and operating and capital costs associated with the properties in each
individual pool. Actual cash payments will be inherently different
from the estimated liability amounts. More detailed discussion is
included in the analysis in the Comparison of Financial Results and
Trends sections below and in Note 11 – Fair Value Measurements in Part
IV, Item 15. An increasing percentage of the costs associated with
the payments from the Net Profits Plan are now being categorized as general and
administrative expense as compared to exploration expense. This is a
function of the normal departure of employees who previously contributed to our
exploration efforts. In December 2007, our Board approved an
incentive compensation plan restructuring, whereby the Net Profits Plan was
replaced with a long-term incentive program utilizing equity
awards. As a result, the 2007 Net Profits Plan pool was the last pool
established.
The
calculation of the estimated liability for the Net Profits Plan is highly
sensitive to our price estimates and discount rate assumptions. For
example, if we changed the commodity prices in our calculation by five percent,
the liability recorded on the balance sheet at December 31, 2009, would differ
by approximately $14 million. A one percentage point decrease in
the discount rate would result in an increase to the liability of approximately
$9 million, while a one percentage point increase in the discount rate would
result in a decrease to the liability of approximately $8 million. We
frequently re-evaluate the assumptions used in our calculations and consider the
possible impacts stemming from the current market environment including current
and future oil and gas prices, discount rates, and overall market
conditions. In 2009 we made adjustments to the discount rate used for
Net Profits Plan pools not in payout. Additionally, we changed the
price assumption used for estimating the liability from a 36-month combination
of historical and future prices to one using NYMEX strip prices at the end of
the respective period.
Outlook
for 2010
The
general economic outlook for the country has improved compared to this time a
year ago. We successfully weathered a tough 2009, and in the process
advanced a number of potential resource plays and improved our financial
condition.
As we
enter 2010, we are well positioned both financially and
operationally. Early in 2009, we extended the maturity of our
revolving credit facility and subsequently paid down outstanding borrowings on
that facility during the year. At the end of 2009, we had almost $500
million available under the revolving credit facility. We have no
debt maturities until 2012. Additionally, we believe access to the
capital markets has improved significantly since last year and that we could
access capital through the public markets if necessary. From an
operational standpoint, we believe 2010 has the potential to be a promising year
for us. We will be building upon our successful testing programs from
2009. We have moved the Eagle Ford shale program much closer to
development mode, and it will receive the largest portion of our capital budget
this year. We will also be allocating more capital toward oil and
rich natural gas projects given their higher returns in the current
56
environment. Specifically,
we will be drilling more Wolfberry tight oil and Bakken/Three Forks wells in the
Permian and Rocky Mountain regions, respectively. We recently began
drilling horizontal wells in the Haynesville shale. We continue to
monitor service costs as the recent uptick in industry activity threatens to
push rates for the drilling and completion of wells higher than the levels we
saw in 2009.
57
Financial
Results of Operations and Additional Comparative Data
We
recorded a net loss for the year ended December 31, 2009 of $99.4 million or
$(1.59) per diluted share compared to 2008 results of net income of $87.3
million or $1.38 per diluted share.
The table
below provides information regarding selected production and financial
information for the quarter ended December 31, 2009, and the immediately
preceding three quarters. Additional details of per MCFE costs are
contained later in this section.
|
For
the Three Months Ended
|
||||||||||||
|
December
31,
|
September
30,
|
June
30,
|
March
31,
|
|||||||||
|
2009
|
2009
|
2009
|
2009
|
|||||||||
|
(In
millions, except production sales data)
|
||||||||||||
|
Production
(BCFE)
|
26.1 | 26.4 | 28.2 | 28.4 | ||||||||
|
Oil
and gas production revenue, excluding the effects of
hedging
|
$ | 187.6 | $ | 152.7 | $ | 145.3 | $ | 130.4 | ||||
|
Realized
oil and gas hedge gain
|
$ | 13.4 | $ | 28.3 | $ | 43.3 | $ | 55.6 | ||||
|
Gain
(loss) on divestiture activity
|
$ | 22.1 | $ | (11.3 | ) | $ | 1.3 | $ | (0.6 | ) | ||
|
Lease
operating expense
|
$ | 34.3 | $ | 34.3 | $ | 35.6 | $ | 41.2 | ||||
|
Transportation
costs
|
$ | 5.2 | $ | 5.3 | $ | 4.6 | $ | 5.5 | ||||
|
Production
taxes
|
$ | 13.3 | $ | 9.0 | $ | 9.3 | $ | 9.1 | ||||
|
DD&A
|
$ | 75.1 | $ | 67.0 | $ | 70.4 | $ | 91.7 | ||||
|
Exploration
|
$ | 13.4 | $ | 15.7 | $ | 19.5 | $ | 13.6 | ||||
|
Impairment
of proved properties
|
$ | 21.6 | $ | 0.1 | $ | 6.0 | $ | 147.0 | ||||
|
Abandonment
and impairment of unproved properties
|
$ | 25.2 | $ | 4.8 | $ | 11.6 | $ | 3.9 | ||||
|
Impairment
of materials inventory
|
$ | 0.8 | $ | 2.1 | $ | 2.7 | $ | 8.6 | ||||
|
General
and administrative
|
$ | 20.7 | $ | 20.8 | $ | 18.2 | $ | 16.4 | ||||
|
Bad
debt recovery
|
$ | (5.2 | ) | $ | - | $ | - | $ | - | |||
|
Change
in Net Profits Plan liability
|
$ | 7.0 | $ | 6.8 | $ | 2.4 | $ | (23.3 | ) | |||
|
Unrealized
derivative (gain) loss
|
$ | 3.2 | $ | 4.1 | $ | 11.3 | $ | 1.8 | ||||
|
Net
income (loss)
|
$ | 1.0 | $ | (4.4 | ) | $ | (8.3 | ) | $ | (87.6 | ) | |
|
Percentage
change from previous quarter:
|
||||||||||||
|
Production
(BCFE)
|
(1)% | (6)% | (1)% | (5)% | ||||||||
|
Oil
and gas production revenue, excluding the effects of
hedging
|
23% | 5% | 11% | (32)% | ||||||||
|
Realized
oil and gas hedge gain
|
(53)% | (35)% | (22)% | 24% | ||||||||
|
Gain
(loss) on divestiture activity
|
(296)% | (969)% | 317% | (106)% | ||||||||
|
Lease
operating expense
|
-% | (4)% | (14)% | (14)% | ||||||||
|
Transportation
costs
|
(2)% | 15% | (16)% | (10)% | ||||||||
|
Production
taxes
|
48% | (3)% | 2% | (23)% | ||||||||
|
DD&A
|
12% | (5)% | (23)% | (4)% | ||||||||
|
Exploration
|
(15)% | (19)% | 43% | (23)% | ||||||||
|
Impairment
of proved properties
|
21,500% | (98)% | (96)% | (50)% | ||||||||
|
Abandonment
and impairment of unproved properties
|
425% | (59)% | 197% | (89)% | ||||||||
|
Impairment
of materials inventory
|
(62)% | (22)% | (69)% | N/A | ||||||||
|
General
and administrative
|
-% | 14% | 11% | 32% | ||||||||
|
Bad
debt recovery
|
N/A | N/A | N/A | N/A | ||||||||
|
Change
in Net Profits Plan liability
|
3% | 183% | (110)% | (71)% | ||||||||
|
Unrealized
derivative (gain) loss
|
(22)% | (64)% | 528% | (115)% | ||||||||
|
Net
income (loss)
|
(123)% | (47)% | (91)% | (31)% | ||||||||
Changes
in production volumes, oil and gas production revenues, and costs reflect the
cyclical and highly volatile nature of our industry. As a result of
the effects of lower commodity prices, we have seen reduced activity among many
exploration and production companies over the past year which has led to lower
lease operating costs over the last two quarters. We believe that
industry activity may be stabilizing to a point where these costs no longer have
much room to decline further. Production taxes are largely dependent
on the prices we receive for oil and natural gas. Depreciation,
depletion, and amortization generally had been pressured upward in recent years
as production related to properties acquired or developed in a higher cost
environment became a larger percentage of our production mix. During
2009, we have seen our DD&A rate fluctuate as a result of impairments and
changes to our underlying proved reserve volumes, both of which have been
affected by the swings in commodity prices we have seen this
year. Additionally, the accounting treatment for assets that are
classified as assets held for sale also impacted our DD&A rate since
properties held for sale are no longer depreciated. A portion of our
general and administrative expense is tied to the net revenues we generate,
which are driven in large part by the realized commodity prices we receive for
our production. The Net Profits Plan and a portion of our current
short-term incentive compensation are tied to net revenues and therefore are
subject to variability.
A
year to year overview of selected reserve, production and financial information,
including trends:
Selected
Operations Data (In thousands, except sales price, volumes, and per MCFE
amounts):
|
As
of and for the Years Ended December 31,
|
Percent
Change Between
|
||||||||||||
|
2009
|
2008
|
2007
|
2009/2008 | 2008/2007 | |||||||||
|
Total proved reserves
|
|||||||||||||
|
Oil
(MMBbl)
|
53.8 | 51.4 | 78.8 | ||||||||||
|
Natural
gas (Bcf)
|
449.5 | 557.4 | 613.5 | ||||||||||
|
BCFE
|
772.2 | 865.5 | 1,086.5 | (11)% | (20)% | ||||||||
|
Net production volumes
|
|||||||||||||
|
Oil
(MMBbl)
|
6.3 | 6.6 | 6.9 | ||||||||||
|
Natural
gas (Bcf)
|
71.1 | 74.9 | 66.1 | ||||||||||
|
BCFE
|
109.1 | 114.6 | 107.5 | (5)% | 7% | ||||||||
|
Average daily production
|
|||||||||||||
|
Oil
(MBbl)
|
17.3 | 18.1 | 18.9 | ||||||||||
|
Natural
gas (MMcf)
|
194.8 | 204.7 | 181.0 | ||||||||||
|
MMCFE
|
298.8 | 313.1 | 294.5 | (5)% | 6% | ||||||||
|
Oil & gas production
revenues
|
|||||||||||||
|
Oil
production, including hedging
|
$ | 359,075 | $ | 500,062 | $ | 432,375 | |||||||
|
Gas
production, including hedging
|
397,526 | 658,242 | 504,202 | ||||||||||
|
Total
|
$ | 756,601 | $ | 1,158,304 | $ | 936,577 | (35)% | 24% | |||||
|
Oil & gas production
costs
|
|||||||||||||
|
Lease
operating expenses
|
$ | 145,463 | $ | 167,384 | $ | 140,389 | |||||||
|
Transportation
costs
|
20,657 | 22,205 | 15,529 | ||||||||||
|
Production
taxes
|
40,680 | 81,766 | 62,290 | ||||||||||
|
Total
|
$ | 206,800 | $ | 271,355 | $ | 218,208 | (24)% | 24% | |||||
|
Average net realized sales price (1)
|
|||||||||||||
|
Oil
(per Bbl)
|
$ | 56.74 | $ | 75.59 | $ | 62.60 | (25)% | 21% | |||||
|
Natural
gas (per Mcf)
|
$ | 5.59 | $ | 8.79 | $ | 7.63 | (36)% | 15% | |||||
|
Per MCFE data
|
|||||||||||||
|
Average
net realized price (1)
|
$ | 6.94 | $ | 10.11 | $ | 8.71 | (31)% | 16% | |||||
|
Lease
operating expense
|
(1.33 | ) | (1.46 | ) | (1.31 | ) | (9)% | 11% | |||||
|
Transportation
costs
|
(0.19 | ) | (0.19 | ) | (0.14 | ) | -% | 36% | |||||
|
Production
taxes
|
(0.37 | ) | (0.71 | ) | (0.58 | ) | (48)% | 22% | |||||
|
General
and administrative
|
(0.70 | ) | (0.69 | ) | (0.56 | ) | 1% | 23% | |||||
|
Operating
profit
|
$ | 4.35 | $ | 7.06 | $ | 6.12 | (38)% | 15% | |||||
|
Depletion,
depreciation and amortization
|
$ | 2.79 | $ | 2.74 | $ | 2.12 | 2% | 29% | |||||
|
(1)
|
Includes
the effects of our hedging
activities.
|
59
We
present per MCFE information because we use this information to evaluate our
performance relative to our peers and to identify and measure trends we believe
require analysis. Volatility in commodity prices has impacted our
operating margins. The decrease in our equivalent realized price for
production has corresponded with the significant downward move in commodity
prices over the last year. While our cost structure has improved over
the past year, it has not moved to the same degree. Our operating
profit of $4.35 per MCFE for the year ended December 31, 2009, decreased 38
percent from the $7.06 per MCFE we realized for the comparable period in
2008.
Average
daily production for the year ended December 31, 2009, decreased to 298.8 MMCFE
compared with 313.1 MMCFE for the same period in 2008. For the year ended
December 31, 2009, our average net realized price decreased by $3.17
per MCFE to $6.94 per MCFE from the same period in 2008. Lower commodity
prices were the principal driver of the decrease in 2009. Unit costs
decreased for the year ended December 31, 2009, as lease operating expense
decreased $0.13 per MCFE to $1.33 per MCFE and production taxes decreased $0.34
per MCFE to $0.37 per MCFE. Production taxes are highly correlated to
commodity prices, and a portion of our general and administrative expense is
linked to our profitability and cash flow. Transportation costs
remained steady at $0.19 per MCFE for the years ended December 31, 2009, and
2008.
For the
year ended December 31, 2009, depletion, depreciation, amortization, and
asset retirement obligation accretion expense, increased $0.05 per MCFE to $2.79
per MCFE compared with the same period in 2008. The depletion,
depreciation, and amortization increase is a result of a decrease in proved
reserves used to calculate DD&A in the first quarter of 2009, please refer
to additional DD&A discussion above. Exploration expense for the
year ended December 31, 2009, was $62.2 million, which was four percent higher
than the $60.1 million incurred during the comparable period in
2008. Geological and geophysical expense increased $6.0 million due
to an increase in the amount spent for seismic analysis. Exploratory
dry hole expense increased $1.0 million. These increases were offset
by a $4.9 million decrease in exploration overhead due to a decrease in Net
Profits Plan payments resulting from decreased oil and gas commodity
prices.
Proved
reserves decreased 11 percent to 772.2 BCFE at December 31, 2009, from
865.5 BCFE at December 31, 2008. Please see Note 16 – Disclosures
about Oil and Gas Producing Activities of Part IV,
Item 15 of this report and the above discussion under the caption General Overview for
additional details and discussion on the individual components of the
change. Over time, our ability to economically replace volumes
produced annually has proven to be a key factor that determines whether we are
successful in achieving our goal of increasing net asset value per
share. The measure of our success will vary year-to-year due to
changes in these factors.
Financial
information (In thousands, except per share amounts):
|
As
of and for the Years Ended December 31,
|
Percent
Change Between
|
||||||||||||
|
2009
|
2008
|
2007
|
2009/2008 | 2008/2007 | |||||||||
|
Working
capital (deficit)
|
$ | (87,625 | ) | $ | 15,193 | $ | (92,604 | ) | (677)% | 116% | |||
|
Long-term
debt
|
$ | 454,902 | $ | 558,713 | $ | 536,070 | (19)% | 4% | |||||
|
Stockholders’
equity
|
$ | 973,570 | $ | 1,162,509 | $ | 902,574 | (16)% | 29% | |||||
|
Net
income
|
$ | (99,370 | ) | $ | 87,348 | $ | 187,098 | (214)% | (53)% | ||||
|
Basic
net income per common share
|
$ | (1.59 | ) | $ | 1.40 | $ | 3.02 | (214)% | (54)% | ||||
|
Diluted
net income per common share
|
$ | (1.59 | ) | $ | 1.38 | $ | 2.90 | (215)% | (52)% | ||||
|
Basic
weighted-average shares outstanding
|
62,457 | 62,243 | 61,852 | -% | 1% | ||||||||
|
Diluted
weighted-average shares outstanding
|
62,457 | 63,133 | 64,850 | (1)% | (3)% | ||||||||
|
Net
cash provided by operating activities
|
$ | 436,106 | $ | 679,190 | $ | 632,054 | (36)% | 7% | |||||
|
Net
cash used in investing activities
|
$ | (304,092 | ) | $ | (673,754 | ) | $ | (805,134 | ) | (55)% | (16)% | ||
|
Net
cash provided by (used in) financing activities
|
$ | (127,496 | ) | $ | (42,815 | ) | $ | 215,126 | 198% | (120)% | |||
60
We
present this table as a summary of information relating to key indicators of
financial condition and operating performance that we believe are
important.
We
account for our 3.50% Senior Convertible Notes under the treasury stock
method. There is no impact on the diluted share calculation for the
periods presented since our average stock price for the relevant reporting
periods has not exceeded the conversion price. The 3.50% Senior
Convertible Notes were issued April 4, 2007, and have not been dilutive for a
reporting period since their issuance. We have in-the-money stock
options, unvested RSUs, and PSAs that may be potentially dilutive
securities. Both basic and diluted earnings per share are presented
in the table above. There were no potentially dilutive shares related
to in-the-money stock options, unvested RSUs, and PSAs included in the diluted
earnings per share calculation for the year ended December 31, 2009,
as we recorded a net loss for the period. A detailed explanation is
presented under the caption Earnings per Share included
in Note 1 – Summary of Significant Accounting Policies, in Part IV, Item 15 of
this report.
Basic and
diluted weighted-average common shares outstanding used in our 2009, 2008, and
2007 earnings per share calculations reflect our stock repurchases, offset by
increases in outstanding shares related to stock option exercises, ESPP shares
issued, and vested RSUs. We issued 189,740 shares of common stock in
2009, 868,372 shares in 2008, and 733,650 shares in 2007 as a result of stock
option exercises. These share issuances were offset by the repurchase
of 2,135,600 shares of common stock in 2008, and 792,216 shares in 2007 through
our stock repurchase plan. Additionally, the number of RSUs that
vested in 2009, 2008, and 2007 were 211,092, 291,659, and 268,123,
respectively.
Additional
Comparative Data in Tabular Format:
|
Change
Between Years
|
||||||
|
Oil and Gas Production
Revenues:
|
2009
and 2008
|
2008
and 2007
|
||||
|
Increase
(decrease) in oil and gas production revenues, net of hedging (in
thousands)
|
$ | (401,703 | ) | $ | 221,727 | |
Components
of Revenue Increases (Decreases):
|
Oil
|
||||||
|
Realized
price change per Bbl, net of hedging
|
$ | (18.85 | ) | $ | 12.99 | |
|
Realized
price percent change
|
(25)% | 21% | ||||
|
Production
change (MBbl)
|
(287 | ) | (292 | ) | ||
|
Production
percentage change
|
(4)% | (4)% | ||||
|
Natural Gas
|
||||||
|
Realized
price change per Mcf, net of hedging
|
$ | (3.20 | ) | $ | 1.16 | |
|
Realized
price percentage change
|
(36)% | 15% | ||||
|
Production
change (MMcf)
|
(3,804 | ) | 8,849 | |||
|
Production
percentage change
|
(5)% | 13% | ||||
Our
product mix as a percentage of total oil and gas revenue and
production:
|
Years
Ended December 31,
|
||||||
|
Revenue
|
2009
|
2008
|
2007
|
|||
|
Oil
|
47% | 43% | 46% | |||
|
Natural
Gas
|
53% | 57% | 54% | |||
|
Production
|
||||||
|
Oil
|
35% | 35% | 39% | |||
|
Natural
Gas
|
65% | 65% | 61% | |||
61
Information
regarding the effects of oil and gas hedging activity:
|
Years
Ended December 31,
|
|||||||||
|
2009
|
2008
|
2007
|
|||||||
|
Oil Hedging
|
|||||||||
|
Percentage
of oil production hedged
|
52% | 61% | 66% | ||||||
|
Oil
volumes hedged (MBbl)
|
3,306 | 4,022 | 4,565 | ||||||
|
Increase
(Decrease) in oil revenue
|
$ |
$14.8 million
|
$ |
(115.1
million
|
) | $ |
(34.3
million
|
) | |
|
Average
realized oil price per Bbl before hedging
|
$ | 54.40 | $ | 92.99 | $ | 67.56 | |||
|
Average
realized oil price per Bbl after hedging
|
$ | 56.74 | $ | 75.59 | $ | 62.60 | |||
|
Natural Gas Hedging
|
|||||||||
|
Percentage
of gas production hedged
|
45% | 46% | 46% | ||||||
|
Natural
gas volumes hedged (MMBtu)
|
$ |
34.3
million
|
$ |
36.4
million
|
$ |
32.5
million
|
|||
|
Increase
in gas revenue
|
$ |
125.9
million
|
$ |
14.0
million
|
$ |
58.7
million
|
|||
|
Average
realized gas price per Mcf before hedging
|
$ | 3.82 | $ | 8.60 | $ | 6.74 | |||
|
Average
realized price per Mcf after hedging
|
$ | 5.59 | $ | 8.79 | $ | 7.63 | |||
Information
regarding the components of exploration expense:
|
Years
Ended December 31,
|
|||||||||
|
Summary of Exploration Expense (in
millions)
|
2009
|
2008
|
2007
|
||||||
|
Geological
and geophysical expenses
|
$ | 20.2 | $ | 14.2 | $ | 17.0 | |||
|
Exploratory
dry holes
|
7.8 | 6.8 | 14.4 | ||||||
|
Overhead
and other expenses
|
34.2 | 39.1 | 27.3 | ||||||
|
Total
|
$ | 62.2 | $ | 60.1 | $ | 58.7 | |||
Comparison
of Financial Results and Trends between 2009 and 2008
Oil and gas production
revenue. Production decreased five percent to 109.1 BCFE for
the year ended December 31, 2009, compared with 114.6 BCFE for the year ended
December 31, 2008. Production for the year ended December 31, 2009,
includes approximately 5.1 BCFE related to non-core properties divested
throughout 2009. Adjusting for divestitures of non-core
properties that were sold in the last two years, production on retained
properties declined slightly from 104.5 BCFE in 2008 to 104.0 BCFE in
2009. The following table presents the regional changes in our
production and oil and gas revenues and costs between the two
years:
|
Average
Net Daily Production Added/(Lost)
|
Pre-Hedge
Oil
and Gas Revenue Added (Lost)
|
Production
Costs Increase (Decrease)
|
||||||
|
(MMCFE)
|
(In
millions)
|
(In
millions)
|
||||||
|
ArkLaTex
|
(9.9 | ) | $ | (115.0 | ) | $ | (1.1 | ) |
|
Mid-Continent
|
8.5 | (142.1 | ) | (16.4 | ) | |||
|
South
Texas & Gulf Coast
|
(12.4 | ) | (97.0 | ) | (13.8 | ) | ||
|
Permian
|
3.7 | (79.1 | ) | (1.7 | ) | |||
|
Rocky
Mountain
|
(4.2 | ) | (210.2 | ) | (31.6 | ) | ||
|
Total
|
(14.3 | ) | $ | (643.4 | ) | $ | (64.6 | ) |
Daily
production decreased by approximately 14.3 MMCFE during 2009 compared to
2008. Production decreased between these two periods as a result of
decreased levels of capital investment throughout
2009 and the lack of contribution in 2009 from properties that were sold in the
second half of 2008. The largest regional
62
increase
between 2009 and 2008 occurred in the Mid-Continent region as a result of
success in the horizontal Woodford shale program in the Arkoma Basin and strong
results from our Deep Springer program in the Anadarko
Basin. Production growth in the Permian region is the result of
continued development of Wolfberry assets at Sweetie Peck and Halff
East. The decrease in the South Texas & Gulf Coast region’s
production is primarily a result of the loss of production from the Judge Digby
Field due to an exchange of assets that occurred in late 2008. The
ArkLaTex decrease is due to natural decline and decreased levels of capital
investment in the region by us and our partners, particularly at the Elm Grove
Field. The Rocky Mountain region realized a slight decline as a
result of its more mature production decline profile and modest capital
investment.
Realized oil and gas hedge gain
(loss). We recorded a net realized hedge gain of $140.6
million for the year ended December 31, 2009, mainly related to favorable
settlements on gas hedges. For the year ended December 31, 2008, we
recorded a net realized hedge loss of $101.1 million mainly due to unfavorable
settlements on oil hedges. Please refer to our discussion above under
the heading Oil and Gas
Prices.
Marketed gas system revenue and
expense. Marketed gas system revenue decreased $18.9 million
to $58.5 million for the year ended December 31, 2009, compared with $77.4
million for the comparable period of 2008. Concurrent with the
decrease in marketed gas system revenue, marketed gas system expense decreased
$14.6 million to $57.6 million for the year ended December 31, 2009,
compared with $72.2 million for the comparable period of
2008. We expect that marketed gas system revenue and expense will
continue to trend with increases and decreases in production and our price
realizations before the impact of hedging.
Gain (loss) on divestiture
activity. We recorded a gain on divestiture
activity of $11.4 million for the year ended
December 31, 2009, compared with $63.6 million for the comparable
period of 2008. The 2009 gain is mainly related to the Hanging Woman
Basin divestiture that closed in December of 2009, which is subject to normal
post-closing adjustments and is expected to be finalized during the first
quarter of 2010. The 2008 gain is mainly related to the Abraxas
divestiture that closed in January 2008. We expect to continue to
evaluate potential divestitures of non-strategic properties.
Oil and gas production
expense. Total production costs decreased $64.6 million or 24
percent to $206.8 million for the year ended December 31, 2009, compared
with $271.4 million in 2008. Total oil and gas production costs per
MCFE decreased $0.47 to $1.89 for the year ended December 31, 2009, compared
with $2.36 in 2008. This decrease is comprised of the
following:
|
·
|
A
$0.34 decrease in production taxes on a per MCFE basis due to the decrease
in realized prices between periods. We expect production taxes
to trend with commodity prices.
|
|
·
|
A
$0.11 decrease in recurring lease operating expense on a per MCFE basis is
related to reductions in recurring LOE that stems from the slowdown in
activity in the exploration and production industry, as well as the
broader economy.
|
|
·
|
A
$0.02 decrease in overall workover LOE on a per MCFE basis is related to a
reduction in the amount of workovers that were performed given the
slowdown in activity in the exploration and production
industry.
|
|
·
|
Transportation
costs on a per MCFE basis remained flat year over
year.
|
Depletion, depreciation,
amortization, and asset retirement obligation liability
accretion. DD&A decreased $10.1 million, or three percent,
to $304.2 million in 2009 compared with $314.3 million in
2008. DD&A expense per MCFE increased two percent to $2.79
in 2009 compared to $2.74 in 2008. The decrease in absolute DD&A
reflects lower total production volumes in 2009 compared to 2008. Our
DD&A
expense per MCFE decreased due to the significant decrease in our carrying value
of our properties as a result of proved property impairments that we incurred in
the fourth quarter of 2008 and the first quarter of 2009. Proved
property impairments and changes in underlying proved reserve volumes will
continue to be affected by the swings in commodity prices.
63
Exploration. Exploration
expense increased $2.1 million or four percent to $62.2 million in 2009 compared
with $60.1 million for 2008. The increase is due to a $1.0 million
increase in exploratory dry hole expense and a $6.0 million increase in
geological and geophysical expense due to an increase in the amount spent on
seismic. We anticipate that we will continue to acquire seismic data
into 2010 in order to minimize risk with respect to the acreage in our emerging
resource plays with the expectation that we can optimize their future
development. These increases were offset by a $4.9 million decrease
in exploration overhead expense due to a decrease in Net Profits Plan payments
as a result of decreased oil and gas commodity prices. We expect
payments made under the Net Profits Plan to trend with commodity
prices.
Impairment of proved
properties. We recorded a $174.8 million impairment of proved
oil and gas properties in 2009 compared to $302.2 million in 2008. A
significant decrease in commodity prices, including differentials, during the
first quarter of 2009 caused the majority of the non-cash
impairment. The largest portion of the impairment in 2009 was $97.3
million related to assets located in the Mid-Continent region which were
impacted at the end of the first quarter by low natural gas prices and wider
than normal differentials. The ArkLaTex region was impacted by a
$20.4 million impairment related to negative pricing and engineering
revisions. We incurred a $14.0 million impairment on proved
properties related to the write-down of certain assets located in the Gulf of
Mexico in which we are relinquishing our ownership interests. We
generally expect proved property impairments will be more likely to occur in
periods of low commodity prices.
Abandonment and impairment of
unproved properties. During 2009, we abandoned or impaired
$45.4 million of unproved properties compared with $39.0 million for
2008. The largest specific components of the 2009 impairment and
abandonment related to the Floyd Shale acreage located in Mississippi and
acreage in Oklahoma. Additionally, we incurred write-offs related to
acreage we believe we will not keep based on our current capital allocation
plans or related to acreage that we do not believe will be prospective. We
generally expect impairments of unproved properties to be more likely to occur
in periods of low commodity prices since fewer dollars will be available for
exploratory and development efforts.
Impairment of
Goodwill. We recorded a $9.5 million impairment of goodwill in
2008. The goodwill was the result of our purchase of Agate Petroleum,
Inc. in January 2005. The impairment was a result of downward price
adjustments to reserves for properties located in our Mid-Continent and Rocky
Mountain regions and represented our entire goodwill balance. We had
no goodwill impairment in 2009.
Impairment of materials
inventory. We recorded a $14.2 million impairment of materials
inventory for the year ended December 31, 2009. There were
no impairments recorded in 2008. The inventory impairment was
caused by a decrease in the value of tubular goods and other raw materials.
Impairments of materials inventory are impacted by fluctuations in the materials
cost environment and increases and decreases in development and exploration
activity, which generally trend with commodity prices.
General and
administrative. General and administrative expense decreased
$3.5 million or four percent to $76.0 million for the year ended
December 31, 2009, compared with $79.5 million for the same period in
2008. G&A increased $0.01 to $0.70 per MCFE for the year ended
December 31, 2009, compared to $0.69 per MCFE for the same period in
2008.
General
and administrative expense decreased due to an $11.3 million decrease in cash
payments made under the Net Profits Plan. As a result of the lower
price realization we received in 2009 compared to 2008,
the payouts from this plan were meaningfully smaller than those paid out in the
prior year. We expect payments made under the Net Profits Plan to
trend with commodity prices.
Compensation
related costs allocated to general and administrative expense increased in
2009. The largest increases were for headcount related costs, such as
salary, benefits, and payroll taxes, which increased $10.6 million for the year
ended December 31, 2009, when compared with the same period in
2008. A significant driver of this headcount increase had been the
conversion from contract lease operators to internal lease operators which began
to take place in 2008. Stock compensation was also up $ 3.3 million
year over year as a result of layering in the second year of stock compensation
amortization from our PSA long-term incentive program.
64
COPAS
overhead reimbursements were $6.4 million higher for the year ended
December 31, 2009, compared with the same period in 2008.
Bad debt expense
(recovery). We recorded a recovery of bad debt expense of $5.2
million in 2009. We recorded $16.7 million of bad debt expense
in 2008 of which $16.6 million was a result of SemGroup L.P. and certain of its
North American subsidiaries filing for bankruptcy protection. Certain
SemGroup entities had purchased a portion of our crude oil
production. This amount related to oil produced in June and July of
2008 that was fully reserved in the year ended
December 31, 2008.
Change in Net Profits Plan
liability. For the year ended December 31, 2009, this non-cash
item was a $7.1 million benefit compared to $34.0 million benefit for the same
period in 2008. Significant decreases in oil and gas commodity prices
have decreased the estimated liability for the future amounts to be paid to plan
participants. This liability is a significant management
estimate. Adjustments to the liability are subject to estimation and
may change dramatically from period to period based on assumptions used for
production rates, reserve quantities, commodity pricing, discount rates, tax
rates, and production costs. We expect the change in this liability
to trend with commodity prices.
Unrealized derivative (gain)
loss. We recognized a loss of $20.5 million for the year ended
December 31, 2009, compared to a gain of $11.2 million for the same
period in 2008. This non-cash item is driven by the change in the
value of our hedge position, as well as the portion of that position that is
considered ineffective for accounting purposes. Please refer to our
discussion under the heading Oil and Gas
Prices.
Other
expense. Other expense increased $3.1 million to $13.5 million
for the year ended December 31, 2009, compared with $10.4 million for the same
period in 2008. During the year ended December 31, 2009, we incurred
$1.5 million of expense related to the assignment of a drilling rig contract in
our Rocky Mountain region. We also incurred a loss related to
hurricanes of $8.3 million for the year ended December 31, 2009, compared with a
loss related to hurricanes of $7.0 million for the same period in
2008.
Income tax benefit
(expense). Income tax benefit totaled $60.1 million for 2009
compared to tax expense of $57.4 million for 2008, resulting in effective tax
rates of 37.7 percent and 39.7 percent, respectively. The effects of
individual components of our tax rate can vary between periods resulting in
fluctuations. The effective rate change from 2008 primarily reflects
the impact of goodwill impairment in that year, but changes in the mix of the
highest marginal state tax rates and differing effects of other permanent
differences, including the impact between years of the domestic production
activities deduction and percentage depletion, also had an
effect. Our current income tax benefit in 2009 is $20.4 million
compared to current income tax expense of $19.2 million in
2008. These amounts are 34 percent and 33 percent, respectively,
of the total income tax benefit or expense for each period. Our 2009 current
income tax benefit reflects creation of a net operating loss which we can carry
back to one or more prior tax years to obtain a refund. In future
years, creation of net operating losses may not create current tax
benefits. During 2009 we observed with interest U.S. Congressional
legislative activity relating to possible changes in taxation of our
industry. If the proposed legislation, which would reduce or
eliminate current tax deductions for intangible drilling costs, the domestic
production activities deduction, and percentage depletion allowance passes, we
would expect our effective tax rate and the cash tax portion of our income tax
expense to increase in the year the legislation becomes effective.
65
Comparison
of Financial Results and Trends between 2008 and 2007
Oil and gas production
revenue. Production increased seven percent to 114.6 BCFE for
the year ended December 31, 2008, compared with 107.5 BCFE for the year ended
December 31, 2007. Production for the year ended December 31, 2007,
includes approximately 6.8 BCFE related to non-core properties divested
throughout 2008. The following table presents the regional changes in
our production and oil and gas revenues and costs between the two
years:
|
Average
Net Daily Production Added/(Lost)
|
Pre-Hedge
Oil
and Gas Revenue Added
|
Production
Costs Increase
|
||||||
|
(MMCFE)
|
(In
millions)
|
(In
millions)
|
||||||
|
ArkLaTex
|
12.8 | $ | 76.1 | $ | 8.3 | |||
|
Mid-Continent
|
(2.8 | ) | 30.4 | 3.9 | ||||
|
South
Texas & Gulf Coast
|
10.8 | 75.4 | 17.5 | |||||
|
Permian
|
8.5 | 85.6 | 11.5 | |||||
|
Rocky
Mountain
|
(10.7 | ) | 79.8 | 11.9 | ||||
|
Total
|
18.6 | $ | 347.3 | $ | 53.1 | |||
We grew
daily production by approximately 18.6 MMCFE during 2008 compared to
2007. The largest regional increase occurred in the ArkLaTex region
as a result of the success in the Cotton Valley and James Lime
programs. Production in the South Texas & Gulf Coast region
increased as a result of two acquisitions of properties targeting the shallow
Olmos gas formation that were made in the second half of 2007 as well as several
successful offshore wells. The production growth in the Permian
region was the result of continued development of the Wolfberry assets at
Sweetie Peck and Halff East. The declines in production in the
Mid-Continent and Rocky Mountain regions were the result of the divestiture of
non-core properties in these regions, which resulted in a smaller production
base for 2008.
Realized oil and gas hedge gain
(loss). We recorded a realized hedge loss of $101.1 million
for the year ended December 31, 2008, mainly related to settlements on oil
hedges. For the year ended December 31, 2007, we recorded a realized
hedge gain of $24.5 million mainly due to favorable settlements on natural gas
hedges.
Marketed gas system revenue and
expense. Marketed gas system revenue increased $32.2 million
to $77.4 million for the year ended December 31, 2008, compared with $45.1
million for the comparable period of 2007. Concurrent with the
increase in marketed gas system revenue, marketed gas system expense increased
$29.7 million to $72.2 million for the year ended December 31, 2008,
compared with $42.5 million for the comparable period of
2007. The net margin has stayed consistent with historical
performance.
Other
revenue. Other revenues decreased $6.6 million to $2.1 million
for the year ended December 31, 2008, compared with $8.7 million for
2007. The decrease was due primarily to a $5.2 million gain
recognized in 2007 associated with a global insurance settlement attributed to
Hurricane Rita.
Gain (loss) on divestiture
activity. We recorded a gain on sale of proved properties of
$63.6 million for the year ended December 31, 2008, mainly
related to the Abraxas divestiture in January 2008.
66
Oil and gas production
expense. Total production costs increased $53.1 million or 24
percent to $271.4 million for 2008, from $218.2 million in
2007. Total oil and gas production costs per MCFE increased $0.33 to
$2.36 for 2008, compared with $2.03 for 2007. This increase was
comprised of the following:
|
·
|
A
$0.05 increase in overall transportation cost on a per MCFE basis was
driven by the addition of Olmos shallow gas assets in the Maverick Basin
that were acquired in the fourth quarter of 2007, as well as wells
completed in 2008 that had higher transportation
costs
|
|
·
|
A
$0.13 increase in production taxes on a per MCFE basis due to the increase
in realized prices between periods, particularly in the oil-weighted Rocky
Mountain and Permian regions
|
|
·
|
A
$0.10 increase in recurring lease operating expense on a per MCFE basis
was related to higher costs, particularly in oil-weighted regions, for
items such as fuel and fluid disposal and an increase in the South Texas
& Gulf Coast region due to wells acquired and developed in South Texas
during the fourth quarter of 2007
|
|
·
|
A
$0.05 overall increase in workover lease operating expense on a per MCFE
basis relating to workover charges in the Mid-Continent and South Texas
& Gulf Coast regions.
|
Depletion, depreciation,
amortization and asset retirement obligation liability
accretion. DD&A increased $86.7 million, or 38 percent, to
$314.3 million in 2008 compared with $227.6 million in
2007. DD&A expense per MCFE increased 29 percent to $2.74 in 2008
compared to $2.12 in 2007. This increase was due to a higher per unit
rate associated with our acquisition and drilling costs in 2008 and 2007 caused
by overall upward cost pressure in the industry in recent years. Additionally,
this increase reflected the costs of production facilities in the offshore Gulf
Coast that had increased significantly in recent years and that started
impacting our DD&A rate as those projects begin production. The
DD&A per MCFE rate was further affected by downward revisions of 244.2 BCFE
of proved reserves due to pricing and performance between December 31, 2008, and
December 31, 2007, causing a general increase in
DD&A.
Exploration. Exploration
expense increased $1.4 million or two percent to $60.1 million in 2008 compared
with $58.7 million for 2007. The increase was due to a $2.8 million
increase in drilling arrangements and a $9.0 million increase in exploration
overhead. These increases were offset by a $2.8 million decrease in
geological and geophysical expense as well as a $7.6 million decrease related to
exploratory dry hole expense due to fewer and less expensive dry
holes.
Impairment of proved
properties. We recorded a $302.2 million impairment of proved
oil and gas properties in 2008 compared to no impairment in
2007. This impairment was primarily due to downward price adjustments
to reserves and declining performance for properties primarily located in the
South Texas & Gulf Coast region, as well as for gas properties in the Rocky
Mountain region.
Abandonment and impairment of
unproved properties. During the year, we abandoned or impaired
$39.0 million of unproved properties. Approximately $13.4
million related to acreage to which we had assigned value in 2007 acquisitions
targeting the Olmos shallow gas formation. The remaining write-offs
related to acreage that we believed we either would not be able to hold in the
current period of limited capital availability or to acreage that we did not
believe would be prospective.
Impairment of
Goodwill. We recorded a $9.5 million impairment of goodwill in
2008. The goodwill was the result of our purchase of Agate Petroleum,
Inc. in January 2005. The impairment was a result of downward price
adjustments to reserves for properties located in our Mid-Continent and Rocky
Mountain regions and represented our entire goodwill balance.
General and
administrative. General and administrative expenses increased
$19.4 million or 32 percent to $79.5 million for 2008, compared with $60.1
million for 2007. G&A increased $0.13 to $0.69 per MCFE for 2008
compared to $0.56 per MCFE for the same period in 2007 as G&A grew at a
faster rate than the seven percent increase in production. A
significant increase in employee count resulted in an increase in base employee
67
compensation,
including taxes and benefits, of approximately $23.9 million between 2008 and
2007. A significant driver of this headcount increase had been the
conversion from contract lease operators to internal lease
operators.
An
increase in 2008 oil and gas commodity prices triggered additional Net Profits
Plan payments. Additionally, an increased percentage of the
distribution dollars under the Net Profits Plan associated with general and
administrative expense contributed to a $4.4 million increase in the current
period realized expense in 2008 compared with the same period in
2007.
Cash
bonus and long-term incentive compensation expense increased by $8.4 million for
the year ended December 31, 2008, compared with the same period in
2007. The increase resulted from the application of the Cash Bonus
Plan as amended on March 28, 2008 and an increase in our employee
count.
The
amounts described above were offset by a $9.1 million increase in the amount of
G&A that was allocated to exploration expense and an $8.2 million increase
in COPAS overhead reimbursements. Our COPAS overhead reimbursements
from operations increased due to an increase in our operated well count from our
drilling program.
Change in Net Profits Plan
liability. For the year ended December 31, 2008, this non-cash
item was a benefit of $34.0 million compared to an expense of $50.8 million for
the same period in 2007. Significant decreases in oil and gas
commodity prices during the last half of 2008 and payments out of the plan have
decreased the estimated liability for the future amounts to be paid to plan
participants.
Bad debt
expense. We recorded $16.7 million of bad debt expense in
2008, of which $16.6 million was a result of SemGroup, L.P. and certain of its
North American subsidiaries filing for bankruptcy protection. Certain
SemGroup entities had purchased a portion of our crude oil
production. This amount related to oil produced in June and July of
2008 that was fully reserved in the year ended
December 31, 2008.
Income tax benefit (expense).
Income tax expense totaled $57.4 million for 2008 and $109.0 million for
2007, resulting in effective tax rates of 39.7 percent and 36.8 percent,
respectively. The effective rate change from 2007 was primarily due
to the impact of goodwill impairment, changes in the mix of the highest marginal
state tax rates, and also reflects other permanent differences including
differing estimated effects between years of the domestic production activities
deduction.
Our
current income tax expense in 2008 was $19.2 million compared to $17.6 million
in 2007. These amounts were 33 percent and 16 percent of the total
income tax expense for the respective periods.
Overview
of Liquidity and Capital Resources
In order
to meet our projected growth targets, we will have to effectively invest capital
into new projects and acquisitions. The following analysis and
discussion includes our assessment of market risk and possible effects of
inflation and changing prices.
Sources
of cash
Based on
our current outlook, we expect our generated cash flow from operations in 2010
plus proceeds from our pending Rocky Mountain oil and other non-core asset
divestiture packages to fund our exploration and development budget for
2010. Accordingly, we do not expect to access the capital markets in
2010. Throughout 2009, we identified and marketed non-core oil and
gas properties. Net cash proceeds from transactions that closed in
2009, after commission costs, were $39.9
million. Subsequent to year end, we closed the Wyoming
68
portion
of our Rocky Mountain oil package and we plan to close the remaining North
Dakota portion by the end of the first quarter of 2010. We anticipate
we will continue to evaluate our property base to identify and divest of
properties we consider non-core to our strategic goals.
Our
primary sources of liquidity are the cash flows provided by operating
activities, use of our credit facility, sales of non-core properties, and access
to capital markets. All of these sources can be impacted by the
general condition of the broad economy and by significant fluctuations in oil
and gas prices, operating costs, and volumes produced all of which affect us and
our industry. We have no control over the market prices for oil and
natural gas, although we are able to influence the amount of our net realized
revenues related to our oil and gas sales through the use of derivative
contracts. The borrowing base on our credit facility could be reduced
as a result of lower commodity prices or sales of non-core producing
properties. Historically, decreases in market prices have limited our
industry’s access to the capital markets. We believe the public debt
markets are currently accessible. Equity and convertible debt
issuances are also available to us as alternative financing
sources. We do not anticipate the need to raise public debt or equity
financing in the near term, however these are options we would consider under
the appropriate circumstances. We intend to rely on our credit
facility for borrowings.
Current
credit facility
On
April 14, 2009, we entered into an amended $1.0 billion senior secured
revolving credit facility with twelve participating banks. The
initial borrowing base was set at $900 million. On
September 29, 2009, the lending group redetermined our reserve-backed
borrowing base under the credit facility at $900 million. We have
been provided a $678 million commitment amount by the bank group. The
new amended credit facility agreement has a maturity date of
July 31, 2012. Management believes that the current
commitment is sufficient for our liquidity needs. To date, we have
experienced no issues drawing upon our credit facility. No individual
bank participating in the credit facility represents more than 16 percent of the
lending commitments under the credit facility. We monitor the credit
environment closely and have frequent discussions with the lending
group.
As of
February 16, 2010, we had $467.0 million of available borrowing capacity
under this facility. Interest and commitment fees are accrued based
on the borrowing base utilization percentage. Euro-dollar loans
accrue interest at LIBOR plus the applicable margin from the utilization table
located in Note 5 of Part IV, Item 15 of this report, and Alternate Base Rate
loans accrue interest at Prime plus the applicable margin from the utilization
table. Outstanding loans reduce the amount available under the
commitment amount on a dollar-for-dollar basis, as do letters of
credit. Borrowings under the facility are secured by mortgages on the
majority of our oil and gas properties and a pledge of the common stock of our
material subsidiary companies.
Our
weighted-average interest rate paid in 2009 was 5.4 percent and included fees
paid on the unused portion of the credit facility’s aggregate commitment amount
and amortization of deferred financing costs and the debt
discount. We decreased our net borrowings from the previous year by
$112.0 million when comparing the ending 2009 and 2008 balance sheet
amounts. A decrease in the average outstanding credit facility
balance throughout 2009, plus a decrease in interest rates, was offset by higher
applicable margins, higher commitment fees on the unused portion of our credit
facility and amortization of upfront financing costs and the 3.50% Senior
Convertible Notes debt discount. This resulted in interest expense of
$28.9 million in 2009 compared with $27.0 million in 2008.
We are
subject to customary covenants under our credit facility, including limitations
on dividend payments and requirements to maintain certain financial ratios,
which include debt to earnings before interest, taxes, depreciation, and
amortization of
less than 3.5 to 1.0 and a current ratio as defined by our credit agreement
of not less than 1.0. As of December 31, 2009, our debt to
EBITDA ratio and current ratio as defined by our credit agreement, were 1.10 and
2.75, respectively. We are in compliance with all covenants under
this credit facility and expect to be in compliance for at least 12
months.
We may
from time to time repurchase certain amounts of our outstanding debt securities
for cash and/or through exchanges for other securities. Such
repurchases or exchanges may be made in open market transactions, privately
negotiated transactions, or otherwise. Any such repurchases or
exchanges will depend on prevailing
69
market
conditions, our liquidity requirements, contractual restrictions, compliance
with securities laws and other factors. The amounts involved in any
such transaction may be material.
Uses
of cash
We use
cash for the acquisition, exploration, and development of oil and gas
properties, and for the payment of debt obligations, trade payables, income
taxes, common stock repurchases, and stockholder dividends. During
2009 we spent $379.3 million of cash on capital development and $76,000 of cash
for property acquisitions. These amounts differ from the cost
incurred amounts based on the timing of cash payments associated with these
activities as compared to the accrual-based activity upon which the costs
incurred amounts are presented. These cash flows were funded using
cash inflows from operations, proceeds from the sale of assets, and available
borrowing capacity under our revolving credit facility.
Expenditures
for exploration and development of oil and gas properties and acquisitions are
the primary use of our capital resources. Our capital and exploration
expenditures in 2010 will be funded with current year operating cash flows and
proceeds from the divestiture of non-core assets. The amount and
allocation of future capital expenditures will depend upon a number of factors
including the number and size of available economic acquisitions and drilling
opportunities, our cash flows from operating, investing and financing
activities, and our ability to assimilate acquisitions. Also the
impact of oil and gas prices on investment opportunities, the availability of
capital and borrowing facilities, and the success of our development and
exploratory activities could lead to changes in funding requirements for future
development. We regularly review our capital expenditure budget to
assess changes in current and projected cash flows, acquisition opportunities,
debt requirements, and other factors.
As of the
filing date of this report we have Board authorization to repurchase up to
3,072,184 shares of our common stock under our stock repurchase
program. Shares may be repurchased from time to time in open market
transactions or privately negotiated transactions subject to market conditions
and other factors including certain provisions of our existing bank credit
facility agreement, compliance with securities laws, and the terms and
provisions of our stock repurchase program. There were no share
repurchases in 2009.
Current
proposals to fund the federal budget include eliminating or reducing current tax
deductions for intangible drilling costs, the domestic production activities
deduction, and percentage depletion. Legislation modifying or
eliminating these deductions would have the immediate effect of reducing
operating cash flows thereby reducing funding available for our exploration and
development capital programs and those of our peers in the
industry. These funding reductions could have a significant adverse
effect on drilling in the United States for a number of years.
In 2009
we paid $6.2 million in dividends to our stockholders. Our intention
is to continue to make these dividend payments for the foreseeable future
subject to our future earnings, our financial condition, possible credit
facility covenants, and other currently unexpected factors which could
arise.
The
following table presents amounts and percentage changes between years in net
cash flows from our operating, investing, and financing
activities. The analysis following the table should be read in
conjunction with our consolidated statements of cash flows in Part IV, Item 15
of this report.
|
Amount
of Changes Between
|
Percent
of Change Between
|
|||||||||
| 2009/2008 | 2008/2007 | 2009/2008 | 2008/2007 | |||||||
|
Net
Cash Provided By (Used in ) Operating Activities
|
$ | (243,084 | ) | $ | 47,136 | (36)% | 7% | |||
|
Net
Cash Provided By Investing Activities
|
$ | 369,662 | $ | 131,380 | (55)% | (16)% | ||||
|
Net
Cash Used In Financing Activities
|
$ | (84,681 | ) | $ | (257,941 | ) | 198% | (120)% | ||
70
Analysis
of cash flow changes between 2009 and 2008
Operating
activities. Cash received from oil and gas production
revenues, net of the realized effects of hedging, decreased $438.5 million to
$751.8 million for the year ended December 31, 2009. The decrease was
the result of a five percent decrease in production and a 31 percent decrease in
our net realized price after hedging, resulting in a 35 percent decrease in
production revenue. Included in the 2009 oil and gas production
revenue amounts is $140.6 million of net realized hedging gains. We
received $9.9 million in income tax refunds in 2009 compared to payments of
$17.3 million during 2008.
Investing
activities. Cash used for investing activities decreased
$369.7 million for the year ended December 31, 2009, compared with the
same period in 2008. Cash outflows for 2009 capital expenditures for
development and exploration activities decreased $367.3 million or 49 percent to
$379.3 million, which reflects a reduced level of activity as a result of
lower commodity prices. Total cash outflow for 2009 related to the
acquisition of oil and gas properties decreased $81.7 million or
100 percent to $76,000. We had no significant acquisitions of
oil and gas properties in 2009, compared with the acquisition of Carthage
Field properties during 2008. Proceeds from an insurance settlement
relating to Hurricane Ike were $16.8 million for the year ended
December 31, 2009, compared with the same period in 2008 when we
received no proceeds from insurance settlements. Proceeds from the
sale of oil and gas properties for the year ended December 31, 2009,
decreased $139.0 million compared to the same period in 2008. Current
year proceeds received from the sale of oil and gas properties relate to
non-core properties located in the Rocky Mountain region that were divested of
in the fourth quarter of 2009. The majority of the 2008 proceeds
related to non-core properties sold to Abraxas in the first quarter of
2008.
Financing
activities. Net repayments to our credit facility increased
$127.0 million for the year ended December 31, 2009, compared to
2008. We spent $11.1 million on debt issuance costs for our amended
credit facility during the year ended December 31, 2009. We did
not incur any debt issuance costs during 2008. Our income tax benefit
attributable to the exercise of stock awards decreased $13.9 million in the year
ended December 31, 2009, compared with 2008. We received
$8.8 million less in proceeds from the sale of common stock in 2009, than
in 2008. Additionally, we invested $77.2 million less to repurchase
shares of our common stock during 2009, than in 2008.
We had
$10.6 million in cash and cash equivalents and a working capital deficit of
$87.6 million as of December 31, 2009, compared to $6.1 million in cash and
cash equivalents and working capital of $15.2 million as of December 31,
2008.
Analysis
of cash flow changes between 2008 and 2007
Operating
activities. Cash received from oil and gas production
revenues, net of the realized effects of hedging, increased $265.2 million to
$1.2 billion for the year ended December 31, 2008. The increase was
the result of a seven percent increase in production and a 16 percent increase
in our net realized price after hedging, resulting in a 24 percent increase in
production revenue. Included in the oil and gas
production revenue amounts was $101.1 million of net realized hedging
losses. Net cash payments made for income taxes increased
$18.5 million due to fluctuating oil and gas prices which increased our
estimated quarterly income tax payments in 2008.
Investing
activities. Total cash outflow for 2008 capital expenditures
for leasehold and drilling activities increased $107.6 million or 17 percent to
$746.6 million. Total cash outflow for 2008 related to the
acquisition of oil and gas properties decreased $101.1 million or 55 percent to
$81.8 million. Cash received from the sale of oil and gas properties
increased $178.4 million and deposits to restricted cash increased $14.4 million
for 2008 as compared to 2007.
Financing
activities. Net repayments to our credit facility decreased
$64.0 million for the year ended December 31, 2008, compared to
2007. We received $280.7 million less during 2008, compared to the
same period in 2007, from the issuance of senior convertible
debt. Our income tax benefit attributable to the exercise of
stock awards increased $3.9 million to $13.9 million for the year ended
December 31, 2008, compared with the
71
same
period in 2007. We received $1.9 million more proceeds from the
sale of common stock in 2008, compared to 2007. Additionally, we
invested $51.3 million more to repurchase shares of our common stock during 2008
compared to 2007.
We had
$6.1 million in cash and cash equivalents and working capital of $15.2 million
as of December 31, 2008, compared to $43.5 million in cash and cash
equivalents and a working capital deficit of $92.6 million as of December
31, 2007.
Capital
Expenditures
The
following table sets forth certain historical information regarding the costs
incurred by us in our oil and gas producing activities.
|
For
the Years Ended December 31,
|
|||||||||
|
2009
|
2008
|
2007
|
|||||||
|
(In
thousands)
|
|||||||||
|
Development
costs
|
$ | 223,108 | $ | 587,548 | $ | 592,275 | |||
|
Exploration
costs
|
154,122 | 92,199 | 111,470 | ||||||
|
Acquisitions
|
|||||||||
|
Proved
properties
|
76 | 51,567 | 161,665 | ||||||
|
Unproved
properties – acquisitions of
proved
properties (1)
|
- | 43,274 | 23,495 | ||||||
|
Unproved
properties - other
|
41,677 | 83,078 | 38,436 | ||||||
|
Total,
including asset retirement obligations(2)(3)
|
$ | 418,983 | $ | 857,666 | $ | 927,341 | |||
|
|
|||||||||
|
(1)
|
Represents
a portion of the allocated purchase price of unproved properties acquired
as part of the acquisition of proved properties. Refer to Note
3 – Acquisitions, Divestitures, and Assets Held for Sale in Part IV, Item
15 of this report for additional
information.
|
|
(2)
|
Includes
capitalized interest of $1.9 million, $4.7 million, and $6.7 million for
the years ended December 31 2009, 2008, and 2007,
respectively.
|
|
(3)
|
Includes
amounts relating to estimated asset retirement obligations of $(805,000),
$15.4 million, and $27.6 million for the years ended December 31 2009,
2008, and 2007, respectively.
|
Commodity
Price Risk and Interest Rate Risk
We are
exposed to market risk, including the effects of changes in oil and gas
commodity prices and changes in interest rates. Changes in interest
rates can affect the amount of interest we earn on our cash, cash equivalents,
and short-term investments and the amount of interest we pay on borrowings under
our revolving credit facility. Changes in interest rates do not
affect the amount of interest we pay on our fixed-rate 3.50% Senior Convertible
Notes, but do affect their fair market value.
Market
risk is estimated as the potential change in fair value resulting from an
immediate hypothetical one percentage point parallel shift in the yield
curve. For fixed-rate debt, interest changes affect the fair market
value but do not impact results of operations or cash
flows. Conversely, interest rate changes for floating-rate debt
generally do not affect the fair market value but do impact future results of
operations and cash flows, assuming other factors are held
constant. The carrying amount of our floating-rate debt typically
approximates its fair value. We had $188.0 million of floating-rate
debt outstanding as of December 31, 2009. Our fixed-rate debt
outstanding, net of debt discount, at this same date was $266.9 million. As of December
31, 2009, we do not have any interest rate hedges in place to mitigate
potential risks.
Since we
produce and sell natural gas and crude oil, our financial results are affected
when prices for these commodities fluctuate. The following table
reflects our estimate of the effect on net cash flows from operations of a ten
percent change in our average realized sales price for natural gas, for oil, and
in combination for the years presented, inclusive of the impact of
hedging. These amounts have been reduced by the effective income tax
rate applicable to each period since a reduction in revenue would reduce cash
requirements to pay income taxes. General and administrative expenses
have not been adjusted. To fund the capital expenditures we
72
incurred
in those years we would have been required to utilize amounts under our credit
facility as a source of funds. In each of these years we would have
had sufficient borrowing base available under our credit facility to meet this
contingency without reducing or eliminating expenditures or altering our growth
strategy.
|
Pro
forma effect on net cash flow from operations of a ten
percent decrease in average realized sales price:
|
|||||||||
|
For
the Years Ended December 31,
|
|||||||||
|
2009
|
2008
|
2007
|
|||||||
|
(In
thousands)
|
|||||||||
|
Oil
|
$ | 29,523 | $ | 27,818 | $ | 25,248 | |||
|
Natural
Gas
|
11,874 | 37,288 | 29,998 | ||||||
|
Total
|
$ | 41,397 | $ | 65,106 | $ | 55,246 | |||
We enter
into hedging transactions in order to reduce the impact of fluctuations in
commodity prices. Please refer to Note 10 – Derivative Financial Instruments of
Part IV, Item 15 of this report for additional information about our oil and gas
derivative contracts, and additional information is below under the caption
Summary of Oil and Gas
Production Hedges in Place. We do not anticipate significant
changes in existing hedge contracts or derivative contract
transactions.
Summary
of Oil and Gas Production Hedges in Place
Our oil
and natural gas derivative contracts include swap and costless collar
arrangements. All contracts are entered into for other-than-trading
purposes. Please refer to Note 10 – Derivative Financial Instruments
in Part IV, Item 15 of this report for additional information regarding
accounting for our derivative transactions.
Our net
realized oil and gas prices are impacted by hedges we have placed on future
forecasted production. Hedging is an important part of our financial
risk management program. The amount of production we hedge is driven
by the amount of debt on our consolidated balance sheet and the level of capital
and long-term commitments we have made. In the case of a significant
acquisition of producing properties, we will consider hedging a portion of the
anticipated production in order to protect the economics assumed at the time of
the acquisition. As of December 31, 2009, and through the date of
this filing, our hedged positions of anticipated production through 2012 totaled
approximately 6 million Bbls of oil, 63 million MMBtu of natural gas, and 1
million Bbls of natural gas liquids.
In a
typical commodity swap agreement, if the agreed-upon published third-party index
price is lower than the swap fixed price, we receive the difference between the
index price per unit of production and the agreed upon swap fixed
price. If the index price is higher than the swap fixed price, we pay
the difference. For collar agreements, we receive the difference
between an agreed upon index and the floor price if the index price is below the
floor price. We pay the difference between the agreed upon contracted
ceiling price and the index price if the index price is above the contracted
ceiling price. No amounts are paid or received if the index price is
between the contracted floor and ceiling prices.
73
The
following table describes the volumes, average contract prices, and fair value
of contracts we have in place as of December 31, 2009. We seek to
minimize basis risk and index the majority of our oil contracts to NYMEX WTI
prices and the majority of our gas contracts to various regional index prices
associated with pipelines in proximity to our areas of gas
production.
Oil
contracts
|
Oil Swaps
|
||||||||
|
Contract Period
|
Volumes
|
Weighted-
Average
Contract
Price
|
Fair
Value at
December
31, 2009
Asset/(Liability)
|
|||||
|
(Bbls)
|
(per
Bbl)
|
(in
thousands)
|
||||||
|
First
quarter 2010
|
468,000 | $ | 69.92 | $ | (4,777 | ) | ||
|
Second
quarter 2010
|
426,000 | $ | 69.46 | (5,180 | ) | |||
|
Third
quarter 2010
|
393,000 | $ | 68.77 | (5,513 | ) | |||
|
Fourth
quarter 2010
|
309,000 | $ | 66.06 | (5,457 | ) | |||
|
2011
|
1,164,000 | $ | 67.06 | (20,977 | ) | |||
|
2012
|
1,051,400 | $ | 82.19 | (5,503 | ) | |||
|
All
oil swap contracts
|
3,811,400 | $ | (47,407 | ) | ||||
|
Oil Collars
|
|||||||||||
|
Contract Period
|
NYMEX
WTI
Volumes
|
Weighted-
Average
Floor
Price
|
Weighted-
Average
Ceiling
Price
|
Fair
Value at
December
31, 2009
Asset/(Liability)
|
|||||||
|
(Bbls)
|
(per
Bbl)
|
(per
Bbl)
|
(in
thousands)
|
||||||||
|
First
quarter 2010
|
337,500 | $ | 50.00 | $ | 64.91 | $ | (5,264 | ) | |||
|
Second
quarter 2010
|
341,000 | $ | 50.00 | $ | 64.91 | (6,198 | ) | ||||
|
Third
quarter 2010
|
344,500 | $ | 50.00 | $ | 64.91 | (6,916 | ) | ||||
|
Fourth
quarter 2010
|
344,500 | $ | 50.00 | $ | 64.91 | (7,378 | ) | ||||
|
2011
|
1,236,000 | $ | 50.00 | $ | 63.70 | (29,707 | ) | ||||
|
All
oil collars
|
2,603,500 | $ | (55,463 | ) | |||||||
Gas
Contracts
|
Gas Swaps
|
||||||||
|
Contract Period
|
Volumes
|
Weighted-
Average
Contract
Price
|
Fair
Value at
December
31, 2009
Asset/(Liability)
|
|||||
|
(MMBtu)
|
(per
MMBtu)
|
(in
thousands)
|
||||||
|
First
quarter 2010
|
||||||||
|
IF
ANR OK
|
160,000 | $ | 6.38 | $ | 136 | |||
|
IF
CIG
|
210,000 | $ | 5.40 | 10 | ||||
|
IF
EL PASO
|
400,000 | $ | 6.94 | 587 | ||||
|
IF
HSC
|
2,270,000 | $ | 9.05 | 7,778 | ||||
|
IF
NGPL
|
460,000 | $ | 5.69 | 82 | ||||
|
IF
NNG VENTURA
|
380,000 | $ | 5.72 | (60 | ) | |||
|
IF
PEPL
|
410,000 | $ | 5.27 | (102 | ) | |||
|
IF
RELIANT
|
1,150,000 | $ | 5.33 | (135 | ) | |||
|
IF
TETCO STX
|
270,000 | $ | 5.66 | 28 | ||||
|
NYMEX
Henry Hub
|
990,000 | $ | 7.38 | 1,719 | ||||
|
Second
quarter 2010
|
||||||||
|
IF
ANR OK
|
150,000 | $ | 5.31 | (3 | ) | |||
|
IF
CIG
|
200,000 | $ | 5.16 | 13 | ||||
|
IF
EL PASO
|
390,000 | $ | 6.00 | 264 | ||||
|
IF
HSC
|
1,870,000 | $ | 7.80 | 4,297 | ||||
|
IF
NGPL
|
430,000 | $ | 5.23 | (31 | ) | |||
|
IF
NNG VENTURA
|
360,000 | $ | 5.71 | 68 | ||||
|
IF
PEPL
|
170,000 | $ | 5.23 | (9 | ) | |||
|
IF
RELIANT
|
1,250,000 | $ | 5.10 | (270 | ) | |||
|
IF
TETCO STX
|
250,000 | $ | 5.64 | 45 | ||||
|
NYMEX
Henry Hub
|
960,000 | $ | 6.75 | 1,144 | ||||
|
Third
quarter 2010
|
||||||||
|
IF
ANR OK
|
70,000 | $ | 5.64 | 6 | ||||
|
IF
CIG
|
240,000 | $ | 5.38 | 13 | ||||
|
IF
EL PASO
|
370,000 | $ | 6.33 | 264 | ||||
|
IF
HSC
|
1,350,000 | $ | 8.03 | 3,119 | ||||
|
IF
NGPL
|
500,000 | $ | 5.43 | (47 | ) | |||
|
IF
NNG VENTURA
|
360,000 | $ | 5.89 | 55 | ||||
|
IF
PEPL
|
230,000 | $ | 5.56 | 7 | ||||
|
IF
RELIANT
|
1,190,000 | $ | 5.37 | (151 | ) | |||
|
IF
TETCO STX
|
230,000 | $ | 5.81 | 37 | ||||
|
NYMEX
Henry Hub
|
960,000 | $ | 6.94 | 1,132 | ||||
|
Fourth
quarter 2010
|
||||||||
|
IF
ANR OK
|
140,000 | $ | 5.97 | 4 | ||||
|
IF
CIG
|
270,000 | $ | 5.87 | 15 | ||||
|
IF
EL PASO
|
370,000 | $ | 6.43 | 190 | ||||
|
IF
HSC
|
590,000 | $ | 8.61 | 1,483 | ||||
|
IF
NGPL
|
430,000 | $ | 5.61 | (124 | ) | |||
|
IF
NNG VENTURA
|
360,000 | $ | 6.34 | 24 | ||||
|
IF
PEPL
|
520,000 | $ | 5.92 | 23 | ||||
|
IF
RELIANT
|
1,350,000 | $ | 5.71 | (219 | ) | |||
|
IF
TETCO STX
|
180,000 | $ | 6.23 | 33 | ||||
|
NYMEX
Henry Hub
|
840,000 | $ | 7.52 | 1,083 | ||||
75
|
Gas Swaps (continued)
|
||||||||
|
Contract Period
|
Volumes
|
Weighted-
Average
Contract
Price
|
Fair
Value at
December
31, 2009
Asset/(Liability)
|
|||||
|
(MMBtu)
|
(per
MMBtu)
|
(in
thousands)
|
||||||
|
2011
|
||||||||
|
IF
ANR OK
|
500,000 | $ | 6.10 | 23 | ||||
|
IF
CIG
|
1,030,000 | $ | 5.96 | 217 | ||||
|
IF
EL PASO
|
1,780,000 | $ | 6.35 | 510 | ||||
|
IF
HSC
|
360,000 | $ | 9.01 | 859 | ||||
|
IF
NGPL
|
1,040,000 | $ | 6.09 | 42 | ||||
|
IF
NNG VENTURA
|
1,200,000 | $ | 6.36 | 34 | ||||
|
IF
PEPL
|
1,830,000 | $ | 6.04 | 39 | ||||
|
IF
RELIANT
|
4,510,000 | $ | 6.13 | 494 | ||||
|
IF
TETCO STX
|
1,420,000 | $ | 6.51 | 465 | ||||
|
NYMEX
Henry Hub
|
2,130,000 | $ | 6.72 | 909 | ||||
|
2012
|
||||||||
|
IF
ANR OK
|
360,000 | $ | 6.18 | (11 | ) | |||
|
IF
CIG
|
1,020,000 | $ | 5.77 | (160 | ) | |||
|
IF
EL PASO
|
850,000 | $ | 6.04 | (139 | ) | |||
|
IF
NGPL
|
660,000 | $ | 6.34 | 94 | ||||
|
IF
NNG VENTURA
|
620,000 | $ | 6.51 | (35 | ) | |||
|
IF
PEPL
|
2,730,000 | $ | 6.25 | 316 | ||||
|
IF
RELIANT
|
2,440,000 | $ | 6.22 | 9 | ||||
|
IF
TETCO STX
|
660,000 | $ | 6.30 | (16 | ) | |||
|
All
gas swap contracts
|
48,420,000 | $ | 26,158 | |||||
|
Gas Collars
|
|||||||||||
|
Contract Period
|
Volumes
|
Weighted-
Average
Floor
Price
|
Weighted-
Average
Ceiling
Price
|
Fair
Value at
December
31, 2009
Asset/(Liability)
|
|||||||
|
(MMBtu)
|
(per
MMBtu)
|
(per
MMBtu)
|
(in
thousands)
|
||||||||
|
First
quarter 2010
|
|||||||||||
|
IF
CIG
|
510,000 | $ | 4.85 | $ | 7.08 | $ | 65 | ||||
|
IF
HSC
|
150,000 | $ | 5.57 | $ | 7.88 | 46 | |||||
|
IF
PEPL
|
1,230,000 | $ | 5.31 | $ | 7.61 | 302 | |||||
|
NYMEX
Henry Hub
|
60,000 | $ | 6.00 | $ | 8.38 | 27 | |||||
|
Second
quarter 2010
|
|||||||||||
|
IF
CIG
|
510,000 | $ | 4.85 | $ | 7.08 | 177 | |||||
|
IF
HSC
|
150,000 | $ | 5.57 | $ | 7.88 | 84 | |||||
|
IF
PEPL
|
1,235,000 | $ | 5.31 | $ | 7.61 | 639 | |||||
|
NYMEX
Henry Hub
|
60,000 | $ | 6.00 | $ | 8.38 | 49 | |||||
|
Third
quarter 2010
|
|||||||||||
|
IF
CIG
|
510,000 | $ | 4.85 | $ | 7.08 | 121 | |||||
|
IF
HSC
|
150,000 | $ | 5.57 | $ | 7.88 | 72 | |||||
|
IF
PEPL
|
1,240,000 | $ | 5.31 | $ | 7.61 | 518 | |||||
|
NYMEX
Henry Hub
|
60,000 | $ | 6.00 | $ | 8.38 | 46 | |||||
|
Fourth
quarter 2010
|
|||||||||||
|
IF
CIG
|
510,000 | $ | 4.85 | $ | 7.08 | (23 | ) | ||||
|
IF
HSC
|
150,000 | $ | 5.57 | $ | 7.88 | 38 | |||||
|
IF
PEPL
|
1,240,000 | $ | 5.31 | $ | 7.61 | 247 | |||||
|
NYMEX
Henry Hub
|
60,000 | $ | 6.00 | $ | 8.38 | 28 | |||||
|
2011
|
|||||||||||
|
IF
CIG
|
1,800,000 | $ | 5.00 | $ | 6.32 | (360 | ) | ||||
|
IF
HSC
|
480,000 | $ | 5.57 | $ | 6.77 | (63 | ) | ||||
|
IF
PEPL
|
4,225,000 | $ | 5.31 | $ | 6.51 | (786 | ) | ||||
|
NYMEX
Henry Hub
|
120,000 | $ | 6.00 | $ | 7.25 | 15 | |||||
|
All
gas collars
|
14,450,000 | $ | 1,242 | ||||||||
Natural
Gas Liquid Contracts
|
Natural Gas Liquid Swaps
|
||||||||
|
Volumes
|
Weighted-
Average
Contract
Price
|
Fair
Value at
December
31, 2009
Asset/(Liability)
|
||||||
|
(approx.
Bbls)
|
(per
Bbl)
|
(in
thousands)
|
||||||
|
First
quarter 2010
|
206,000 | $ | 46.73 | $ | (770 | ) | ||
|
Second
quarter 2010
|
191,000 | $ | 46.28 | (364 | ) | |||
|
Third
quarter 2010
|
179,000 | $ | 46.20 | (339 | ) | |||
|
Fourth
quarter 2010
|
169,000 | $ | 46.16 | (424 | ) | |||
|
2011
|
480,000 | $ | 43.20 | (2,334 | ) | |||
|
2012
|
214,000 | $ | 43.70 | (1,181 | ) | |||
|
All
natural gas liquid swaps
|
1,439,000 | $ | (5,412 | ) | ||||
Please
see Note 10 – Derivative Financial Instruments in Part IV, Item 15 of this
report for additional information regarding our oil and gas hedges.
Schedule
of Contractual Obligations
The
following table summarizes our future estimated principal payments and minimum
lease payments for the periods specified (in millions):
|
Contractual
Obligations
|
Total
|
Less
than 1 year
|
1-3
years
|
3-5
years
|
More
than 5 years
|
||||||||||
|
Long-Term
Debt
|
$ | 498.2 | $ | 10.1 | $ | 488.1 | $ | - | $ | - | |||||
|
Operating
Leases
|
61.1 | 27.8 | 9.7 | 5.3 | 18.3 | ||||||||||
|
Other
Long-Term Liabilities
|
302.8 | 92.1 | 125.1 | 59.9 | 25.7 | ||||||||||
|
Total
|
$ | 862.1 | $ | 130.0 | $ | 622.9 | $ | 65.2 | $ | 44.0 | |||||
This
table includes the remaining unfunded portion of our estimated pension liability
of $9.5 million even though we recognize that we cannot determine with
accuracy the timing of future payments. The Company is not required
to make a contribution to the Pension Plan in 2010. We made
contributions of $2.0 million, $2.5 million, and $2.2 million in 2009, 2008, and
2007, respectively, towards the pension liability. The table also
includes $166.1 million in other long-term liabilities that represents six years
of undiscounted forecasted payments for the Net Profits
Plan. Payments are expected to be similar on an annual
basis for the years beyond what is shown in this table. The
amounts recorded on the consolidated balance sheets reflect all future Net
Profits Plan payments and the impact of discounting and therefore differ from
the amounts disclosed in this table. The variability in the amount of
payments will be a direct reflection of commodity prices, production rates,
capital expenditures, and operating costs in future
periods. Predicting the timing and amounts of payments associated
with this liability is contingent upon estimates of appropriate discount
factors, adjusting for risk and time value, and upon a number of factors that we
cannot control. The components of the operating leases are discussed
in more detail in Note 6 – Commitments and Contingencies of Part IV, Item 15 of
this report.
The
scheduled repayment of the long-term credit facility is
2012. Accordingly, it has been disclosed in the table as
such. Since this is a revolving credit facility, the actual payments
will vary significantly. We anticipate refinancing this obligation
prior to its expiration date. For purposes of this table, we assume
we will net share settle the 3.50% Senior Convertible
Notes. Accordingly, $22.7 million of interest payments related
to the 3.50% Senior Convertible Notes are included in the long-term debt line in
table above. We have excluded asset retirement obligations because we
are not able to accurately predict the precise timing of these
amounts. Pension
78
liabilities,
asset retirement obligations, and Net
Profits Plan are discussed in Note 8 – Pension Benefits, Note 9 – Asset
Retirement Obligations, and Note 7 – Compensation Plans of Part IV, Item 15 of
this report.
This
table also includes estimated oil and natural gas derivative payments of $119.4
million based on future market prices as of December 31, 2009. This
amount represents only the cash outflows; it does not include estimated oil and
gas derivative receipts of $38.0 million that would be paid based on December
31, 2009, market prices. The net liability of $81.4 million
represents cash flows from the intrinsic value of our collar arrangements and
differs in amount from our recorded fair value, which as of December 31, 2009,
was a net liability of $80.9 million. The fair value considers time
value, volatility, and the risk of non-performance for us and for our
counterparties. Both the intrinsic value and fair value will change
as oil and natural gas commodity prices change. Please refer to the
discussion above under the caption Summary of Oil and Gas Production
Hedges in Place and Note 10 – Derivative Financial Instruments
in Part IV, Item 15 of this report for additional information regarding our oil
and gas hedges.
We
believe that we will continue to pay annual dividends of $0.10 per
share. We anticipate making cash payments for income taxes, dependent
on net income and capital spending.
Off-balance
Sheet Arrangements
As part
of our ongoing business, we have not participated in transactions that generate
relationships with unconsolidated entities or financial partnerships, such as
entities often referred to as structured finance or special purpose entities,
which would have been established for the purpose of facilitating off-balance
sheet arrangements or other contractually narrow or limited
purposes. As of December 31, 2009, we have not been involved in any
unconsolidated SPE transactions.
We
evaluate our transactions to determine if any variable interest entities
exist. If it is determined that we are the primary beneficiary of a
variable interest entity, that entity is consolidated into our consolidated
financial statements.
Critical
Accounting Policies and Estimates
Our
discussion of financial condition and results of operations is based upon the
information reported in our consolidated financial statements. The
preparation of these consolidated financial statements requires us to make
assumptions and estimates that affect the reported amounts of assets,
liabilities, revenues, and expenses as well as the disclosure of contingent
assets and liabilities as of the date of our financial statements. We
base our decisions affecting the estimates we use on historical experience and
various other sources that are believed to be reasonable under the
circumstances. Actual results may differ from the estimates we
calculate due to changes in business conditions or due to unexpected
circumstances. Policies we believe are critical to understanding our
business operations and results of operations are detailed below. For
additional information on our significant accounting policies, please refer to
Note 1 – Summary of Significant Accounting Policies, Note 9 – Asset Retirement
Obligations, and Note 16 – Disclosures about Oil and Gas Producing Activities in
Part IV, Item 15 of this report.
Proved Oil and gas reserve
quantities. Estimated reserve quantities and the related
estimates of future net cash flows are critical estimates for our company
because they affect the perceived value of an exploration and production
company. Additionally, they are used in comparative financial
analysis ratios and are used as the basis for the most significant accounting
estimates in our financial statements. Those significant accounting
estimates include the periodic calculations of depletion, depreciation, and
impairment of our proved oil and gas properties and the estimates of our
liability for future payments under the Net Profits Plan. Future cash
inflows and future production and development costs are determined by applying
prices and costs, including transportation, quality differentials, and basis
differentials, applicable to each period to the estimated quantities of proved
oil and gas reserves remaining to be produced as of the end of that
period. Expected cash flows are discounted to present value using a
discount rate that depends upon the purpose for which the reserve estimates will
be used. For example, the standardized measure calculations required
by Accounting Standards Codification Topic 932
79
Extractive Activities – Oil and
Gas requires a ten percent discount rate to be
applied. Although reserve estimates are inherently imprecise, and
estimates of new discoveries and undeveloped locations are more imprecise than
those of established producing oil and gas properties, we make a considerable
effort in estimating our reserves, including using independent reserve
engineering consultants. We expect that periodic reserve estimates
will change in the future as additional information becomes available and as oil
and gas prices and operating and capital costs change. We evaluate
and estimate our proved oil and gas reserves at December 31 and June 30 of each
year. For purposes of depletion, depreciation, and impairment,
reserve quantities are adjusted at all interim periods for the estimated impact
of additions and dispositions. Changes in depletion, depreciation, or
impairment calculations caused by changes in reserve quantities or net cash
flows are recorded in the period the reserve estimates change.
The
following table presents information regarding reserve changes from period to
period that reflect changes from items we do not control, such as price, and
from changes resulting from better information due to production history, and
from well performance. These changes do not require a capital
expenditure on our part, but may have resulted from capital expenditures we
incurred to develop other estimated proved reserves.
|
For
the Years Ended December 31,
|
||||||||
|
2009
|
2008
|
2007
|
||||||
|
BCFE
|
BCFE
|
BCFE
|
||||||
|
Change
|
Change
|
Change
|
||||||
|
Revisions
resulting from price changes
|
12.0 | (199.7 | ) | 34.5 | ||||
|
Revisions
resulting from performance
|
(61.6 | ) | (44.5 | ) | 6.4 | |||
|
Total
|
(49.6 | ) | (244.2 | ) | 40.9 | |||
We have
added 282.8 BCFE of reserves over a three-year period, excluding
divestitures. A 99.7 BCFE decrease in reserves was a result of
changes in engineering estimates based on the performance of our oil and gas
properties. A 153.2 BCFE decrease in reserves was a result of price
changes. As previously noted, oil and gas prices are volatile, and
estimates of reserves are inherently imprecise. Consequently, we
anticipate we may continue to experience these types of changes.
The
following table reflects the estimated BCFE change and percentage change to our
total reported reserve volumes from the described hypothetical
changes:
|
For
the Years Ended December 31,
|
||||||||||||
|
2009
|
2008
|
2007
|
||||||||||
|
BCFE
|
Percentage
|
BCFE
|
Percentage
|
BCFE
|
Percentage
|
|||||||
|
Change
|
Change
|
Change
|
Change
|
Change
|
Change
|
|||||||
|
A
10% decrease in pricing
|
(25.1 | ) | (3)% | (120.8 | ) | (14)% | (16.3 | ) | (2)% | |||
|
A
10% decrease in proved undeveloped reserves
|
(14.2 | ) | (2)% | (15.0 | ) | (2)% | (25.0 | ) | (2)% | |||
Additional
reserve information can be found in the reserve table and discussion included in
Items 1 and 2 of Part I of this report.
Successful efforts method of
accounting. Generally accepted accounting principles provide
for two alternative methods for the oil and gas industry to use in accounting
for oil and gas producing activities. These two methods are generally
known in our industry as the full cost method and the successful efforts
method. Both methods are widely used. The methods are
different enough that in many circumstances the same set of facts will provide
materially different financial statement results within a
given year. We have chosen the successful efforts method of
accounting for our oil and gas producing activities, and a detailed description
is included in Note 1 of Part IV, Item 15 of this report.
80
Revenue
recognition. Our revenue recognition policy is significant
because revenue is a key component of our results of operations and our
forward-looking statements contained in our analysis of liquidity and capital
resources. We derive our revenue primarily from the sale of produced
natural gas, natural gas liquids, and crude oil. We report revenue as
the gross amounts we receive before taking into account production taxes and
transportation costs, which are reported as separate
expenses. Revenue is recorded in the month our production is
delivered to the purchaser, but payment is generally received between 30 and 90
days after the date of production. No revenue is recognized unless it
is determined that title to the product has transferred to a
purchaser. At the end of each month we make estimates of the amount
of production delivered to the purchaser and the price we will
receive. We use our knowledge of our properties, their historical
performance, NYMEX and local spot market prices, and other factors as the basis
for these estimates. Variances between our estimates and the actual
amounts received are recorded in the month payment is received. A ten
percent change in our year-end revenue accrual would have impacted net income
before tax by approximately $8 million in 2009.
Crude oil and natural gas
hedging. Our crude oil and natural gas hedging contracts are
intended to and usually do qualify for cash flow deferral hedge
accounting under Accounting Standards Codification Topic 815. Under
this guidance a majority of the gain or loss from a contract qualifying as a
cash flow hedge is deferred from recognition in the consolidated statement of
operations. The realized gain or loss reflected in the consolidated
statement of operations is based on actual hedge contract
settlements. If our natural gas and crude oil hedge contracts did not
qualify for hedge accounting treatment or if we chose not to use hedge
accounting methodology, our periodic consolidated statements of operations could
include significant changes in the estimate of non-cash derivative gain or loss
due to swings in the value of these contracts. Consequently, we would
report a different amount of oil and gas hedge loss in our statements of
operations. These fluctuations could be especially significant in a
volatile pricing environment such as what we have encountered over the last few
years. The amounts recorded to accumulated other comprehensive income
(loss) of $103.3 million of loss, $223.5 million of income, and $170.0 million
of loss for 2009, 2008, and 2007, respectively, would have increased or
decreased net income after tax if our hedges did not qualify as cash flow
deferral hedges under Accounting Standards Codification Topic 815.
Change in Net Profits Plan
Liability. We record the estimated liability of future
payments for our Net Profits Plan. The estimated liability is
calculated based on a number of assumptions, including estimates of proved oil
and gas reserves, recurring and workover lease operating expense, production and
ad valorem tax rates, present value discount factors, and pricing
assumptions. Additional discussion is included in the analysis in the
above section titled Overview
of the Company, under the heading Net Profits
Plan. In December 2007 our Board approved an incentive
compensation plan restructuring whereby the Net Profits Plan was replaced with a
long-term incentive program utilizing performance shares. As a
result, the 2007 Net Profits Plan pool was the last pool
established.
Asset retirement
obligations. We are required to recognize an estimated
liability for future costs associated with the abandonment of our oil and gas
properties. We base our estimate of the liability on our historical
experience in abandoning oil and gas wells projected into the future based on
our current understanding of federal and state regulatory
requirements. Our present value calculations require us to estimate
the economic lives of our properties, assume what future inflation rates apply
to external estimates, and determine what credit adjusted risk-free rate
discount to use. The impact to the consolidated statement of
operations from these estimates is reflected in our depreciation, depletion, and
amortization calculations and occurs over the remaining life of our oil and gas
properties.
Valuation of long-lived and
intangible assets. Our property and equipment are recorded at
cost. An impairment allowance is provided on unproven property when
we determine that the property will not be developed or the carrying value will
not be realized. We evaluate the realizability of our proved
properties and other long-lived assets whenever events or changes in
circumstances indicate that impairment may be appropriate. Our
impairment test compares the expected undiscounted future net revenues from
property, using escalated pricing, with the related net capitalized cost of the
property at the end of each period. When the net capitalized costs
exceed the undiscounted future net revenue of a property, the cost of the
property is written down to its estimate of fair value, which is determined by
applying a discount rate we believe is indicative of the current
market. Our criteria for an acceptable internal rate of return are
subject to change over time. Different pricing
81
assumptions
or discount rates could result in a different calculated
impairment. We recorded a $174.8 million impairment of proved oil and
gas properties in 2009. A significant decrease in commodity prices
and increase in differentials during the first quarter of 2009 caused the
majority of the non-cash impairment. The largest portion of the
impairment in 2009 was $97.3 million related to assets located in the
Mid-Continent region that were significantly impacted by lower prices and wider
than normal differentials.
Income taxes. We
provide for deferred income taxes on the difference between the tax basis of an
asset or liability and its carrying amount in our financial statements in
accordance with Accounting Standards Codification Topic 740. This
difference will result in taxable income or deductions in future years when the
reported amount of the asset or liability is recovered or settled,
respectively. Considerable judgment is required in determining when
these events may occur and whether recovery of an asset is more likely than
not. Additionally, our federal and state income tax returns are
generally not filed before the consolidated financial statements are prepared,
therefore, we estimate the tax basis of our assets and liabilities at the end of
each period as well as the effects of tax rate changes, tax credits, and net
operating and capital loss carryforwards and carrybacks. Adjustments
related to differences between the estimates we use and actual amounts we report
are recorded in the periods in which we file our income tax
returns. These adjustments and changes in our estimates of asset
recovery and liability settlement could have an impact on our results of
operations. A one percent change in our effective tax rate would have
changed our calculated income tax benefit by $675,000 for the year ended
December 31, 2009.
Other
Liquidity and Capital Resources Information
Pension
Benefits
Substantially
all of our employees who meet age and service requirements participate in a
non-contributory defined benefit pension plan. At December 31, 2009, and
2008, our underfunded status was $9.4 million and $8.2 million,
respectively. The increase in underfunding from 2008 to 2009 was primarily
attributable to lower discount rates, which were 6.6 percent in 2008 and 6.1
percent in 2009. Our pension plan assets increased from $6.6 million at
December 31, 2008, to $9.1 million at December 31, 2009. On an
Employee Retirement Income Security Act basis, the Company’s pension plan
remains fully funded at January 1, 2010. We are not required to make any
contributions to the pension plan in 2010. For additional information
please refer to Note 8 – Pension Benefits in Part IV, Item 15 of this
report.
Accounting
Matters
Please
refer to Note 5 – Long-term Debt, Note 8 – Pension Benefits, Note 10 -
Derivative Financial Instruments, Note 11 – Fair Value Measurements, Note 16 –
Disclosures about Oil and Gas Producing Activities, and the section entitled
“Recently Issued Accounting
Standards” under Note 1 – Summary of Significant Accounting Policies for
additional information on the recent adoption of new authoritative accounting
guidance in Part IV, Item 15 of this report.
Environmental
St.
Mary’s compliance with applicable environmental regulations has to date not
resulted in significant capital expenditures or material adverse effects on our
liquidity or results of operations. We believe we are in substantial
compliance with environmental regulations and do not currently anticipate that
material future expenditures will be required under the existing regulatory
framework. However, we are unable to predict the impact that
compliance with future laws or regulations, such as those currently being
considered as discussed below, may have on future capital expenditures,
liquidity, and results of operations.
The U.S.
Congress is currently considering legislation that would amend the Safe Drinking
Water Act to eliminate an existing exemption from federal regulation of
hydraulic fracturing activities. Hydraulic fracturing is a common
process in our industry of creating artificial cracks, or fractures, in deep
underground rock formations through the pressurized injection of water, sand and
other additives to enable oil or natural gas to move more easily through the
rock pores to a production well. This process is often necessary to
produce commercial
82
quantities
of oil and natural gas from many reservoirs, especially shale rock
formations. We routinely utilize hydraulic fracturing in many of our
reservoirs, and our Eagle Ford, Haynesville, Marcellus, and Woodford
shale programs utilize or contemplate the utilization of hydraulic
fracturing. Currently, regulation of hydraulic fracturing is
primarily conducted at the state level through permitting and other compliance
requirements. If adopted, the proposed amendment to the Safe Drinking
Water Act could result in additional regulations and permitting requirements at
the federal level. Those additional regulations and permitting
requirements, as well as other regulatory developments at the state level, could
lead to significant operational delays and increased operating costs, and could
make it more difficult to perform hydraulic fracturing.
Climate
Change
Climate
change has become the subject of an important public policy
debate. While climate change remains a complex issue, scientific
research suggests that an increase in greenhouse gas emissions may pose a risk
to society and the environment. The oil and natural gas exploration
and production industry is a source of certain greenhouse gas emissions, namely
carbon dioxide and methane, and future restrictions on the combustion of fossil
fuels or the venting of natural gas could have a significant impact on our
future operations. We are actively monitoring the following climate
change related issues:
Impact of Legislation and
Regulation. The commercial risk associated with the
exploration and production of fossil fuels lies in the uncertainty of
government-imposed climate change legislation, including cap and trade systems,
and regulations that may affect us, our suppliers, and our
customers. The cost of meeting these requirements may have an adverse
impact on our financial condition, results of operations and cash flows, and
could reduce the demand for the oil and natural gas that we
produce. The U.S. Congress and several states are considering
adopting climate change legislation. However, the current state of
development of many state and federal climate change regulatory initiatives
makes it difficult to predict with certainty the future impact on us, including
accurately estimating the related compliance costs that we may
incur.
Impact of U.S. Participation in
International Accords. The U.S. has
participated in international discussions to develop a treaty or other agreement
to require reductions in greenhouse gas emissions after 2012, and has indicated
that it wishes to associate itself with the Copenhagen Accord, which includes a
non-binding commitment to reduce greenhouse gas emissions. While no
specific new international climate change accord has been adopted that would
affect our current operating locations, the current state of development of many
initiatives makes it difficult to assess the timing or effect of any pending
discussions of future accords or predict with certainty the future costs that we
may incur in order to comply with any applicable requirements from future
international treaties or regulations.
Indirect Consequences of Regulation
or Business Trends. We believe that there are both risks and
opportunities arising from climate change issues. See Items 1 and 2.
Business and Properties – Government Regulations, and the following risk factors
listed in Item 1A. Risk Factors –
|
·
|
We are subject to operating
and environmental risks and hazards that could result in substantial
losses.
|
|
·
|
Our operations are subject to
complex laws and regulations, including environmental regulations that
result in substantial costs and other
risks.
|
|
·
|
Possible legislation and
regulations related to global warming and climate change could have an
adverse effect on our operations and the demand for oil and natural
gas.
|
In terms
of opportunities, the regulation of greenhouse gas emissions and the
introduction of alternative incentives, such as enhanced oil recovery, carbon
sequestration and low carbon fuel standards, could benefit us in a variety of
ways. For example, although climate change legislation could reduce
the overall demand for the oil and natural gas that we produce, the relative
demand for natural gas may increase since the burning of natural gas produces
lower levels of emissions than other readily available fossil fuels such as oil
and coal. In addition, if renewable resources, such as wind or solar
power become more prevalent, natural gas-fired electric plants may
83
provide
an alternative backup to maintain consistent electricity
supply. Also, if states adopt low-carbon fuel standards, natural gas
may become a more attractive transportation fuel. More than 60% of
our 2009 production on an MCFE basis was natural gas. Market-based
incentives for the capture and storage of carbon dioxide in underground
reservoirs, particularly in oil and natural gas reservoirs, could also benefit
us through the potential to obtain greenhouse gas emission allowances or offsets
from or government incentives for the sequestration of carbon
dioxide.
Physical Impacts of Climate Change
on our Costs and Operations. There has been public discussion
that climate change may be associated with extreme weather conditions such as
more intense hurricanes, thunderstorms, tornados and snow or ice storms, as well
as rising sea levels. Extreme weather conditions can increase our
costs, and damage resulting from extreme weather may not be fully
insured. However, the extent to which climate change may lead to
increased storm or weather hazards affecting our operations is difficult to
identify at this time. See Item 1A. Risk Factors – We are subject to operating and
environmental risks and hazards that could result in substantial
losses.
ITEM
7A. QUANTITATIVE
AND QUALITATIVE DISCLOSURES ABOUT MARKET RISK
The
information required by this item is provided under the captions “Commodity Price Risk and Interest
Rate Risk,” “Summary of
Oil and Gas Production Hedges in Place,” and “Summary of Interest Rate Hedges in
Place” in Item 7 above and is incorporated herein by
reference.
ITEM
8. FINANCIAL
STATEMENTS AND SUPPLEMENTARY DATA
The
Consolidated Financial Statements that constitute Item 8 follow the text of this
report. An index to the Consolidated Financial Statements and
Schedules appears in Item 15(a) of this report.
ITEM
9. CHANGES
IN AND DISAGREEMENTS WITH ACCOUNTANTS ON ACCOUNTING AND FINANCIAL
DISCLOSURE
None.
ITEM
9A. CONTROLS
AND PROCEDURES
We
maintain a system of disclosure controls and procedures that are designed to
ensure that information required to be disclosed in our SEC reports is recorded,
processed, summarized, and reported within the time periods specified in the
SEC’s rules and forms, and to ensure that such information is accumulated and
communicated to our management, including the Chief Executive Officer and the
Chief Financial Officer, as appropriate, to allow for timely decisions regarding
required disclosure.
We
carried out an evaluation, under the supervision and with the participation of
our management, including the Chief Executive Officer and the Chief Financial
Officer, of the effectiveness of the design and operation of our disclosure
controls and procedures as of the end of the period covered by the Annual Report
on Form 10-K. Based upon that evaluation, the Chief Executive Officer
and the Chief Financial Officer concluded that our disclosure controls and
procedures are effective for the purpose discussed above as of the end of the
period covered by this Annual Report on Form 10-K. There was no
change in our internal control over financial reporting that occurred during our
most recent fiscal quarter that has materially affected, or is reasonably likely
to materially affect, our internal control over financial
reporting.
MANAGEMENT’S
REPORT ON INTERNAL CONTROL OVER FINANCIAL REPORTING
To the
Stockholders’ of St. Mary Land & Exploration Company
Management
of the Company is responsible for establishing and maintaining adequate internal
control over financial reporting as defined in Rules 13a-15(f) and 15d-15(f)
under the Securities Exchange Act of 1934, as amended. The Company’s
internal control over financial reporting is designed to provide reasonable
assurance regarding the reliability of financial reporting and the preparation
of financial statements for external purposes in accordance with generally
accepted accounting principles. The Company’s internal control over
financial reporting includes those policies and procedures that:
|
(i)
|
Pertain
to the maintenance of records that, in reasonable detail, accurately and
fairly reflect the transactions and dispositions of the assets of the
Company;
|
|
(ii)
|
Provide
reasonable assurance that transactions are recorded as necessary to permit
preparation of financial statements in accordance with generally accepted
accounting principles, and that receipts and expenditures of the Company
are being made only in accordance with authorizations of management and
directors of the Company; and
|
|
(iii)
|
Provide
reasonable assurance regarding prevention or timely detection of
unauthorized acquisition, use, or disposition of the Company’s assets that
have a material effect on the financial
statements.
|
Because
of the inherent limitations, internal controls over financial reporting may not
prevent or detect misstatements. Also, projections of any evaluation
of effectiveness to future periods are subject to the risk that controls may
become inadequate because of the changes in conditions, or that the degree of
compliance with the policies and procedures may deteriorate.
Management
assessed the effectiveness of the Company’s internal control over financial
reporting as of December 31, 2009. In making this assessment,
management used the criteria set forth by the Committee of Sponsoring
Organizations of the Treadway Commission in Internal Control-Integrated
Framework.
Based on
our assessment and those criteria, management believes that the Company
maintained effective internal control over financial reporting as of December
31, 2009.
The
Company’s independent registered public accounting firm has issued an
attestation report on the Company’s internal controls over financial
reporting. That report immediately follows this report.
|
/s/ ANTHONY J. BEST
|
/s/ A. WADE PURSELL
|
|
Anthony
J. Best
|
A.
Wade Pursell
|
|
President
and Chief Executive Officer
|
Executive
Vice President and Chief Financial Officer
|
|
February
23, 2010
|
February
23, 2010
|
REPORT OF
INDEPENDENT REGISTERED PUBLIC ACCOUNTING FIRM
To the
Board of Directors and Stockholders of
St. Mary
Land & Exploration Company and Subsidiaries
Denver,
Colorado
We have
audited the internal control over financial reporting of St. Mary Land &
Exploration Company and subsidiaries (the “Company”) as of December 31, 2009,
based on criteria established in Internal Control – Integrated
Framework issued by the Committee of Sponsoring Organizations of the
Treadway Commission. The Company’s management is responsible for
maintaining effective internal control over financial reporting and for its
assessment of the effectiveness of internal control over financial reporting,
included in the accompanying Management’s Report on Internal Control Over
Financial Reporting. Our responsibility is to express an opinion on
the Company’s internal control over financial reporting based on our
audit.
We
conducted our audit in accordance with the standards of the Public Company
Accounting Oversight Board (United States). Those standards require
that we plan and perform the audit to obtain reasonable assurance about whether
effective internal control over financial reporting was maintained in all
material respects. Our audit included obtaining an understanding of
internal control over financial reporting, assessing the risk that a material
weakness exists, testing and evaluating the design and operating effectiveness
of internal control based on the assessed risk, and performing such other
procedures as we considered necessary in the circumstances. We
believe that our audit provides a reasonable basis for our opinion.
A
company’s internal control over financial reporting is a process designed by, or
under the supervision of, the company’s principal executive and principal
financial officers, or persons performing similar functions, and effected by the
company’s board of directors, management, and other personnel to provide
reasonable assurance regarding the reliability of financial reporting and the
preparation of the financial statements for external purposes in accordance with
generally accepted accounting principles. A company’s internal
control over financial reporting includes those policies and procedures that (1)
pertain to the maintenance of records that, in reasonable detail, accurately and
fairly reflect the transactions and dispositions of the assets of the company;
(2) provide reasonable assurance that transactions are recorded as necessary to
permit preparation of financial statements in accordance with generally accepted
accounting principles, and that receipts and expenditures of the company are
being made only in accordance with authorizations of management and directors of
the company; and (3) provide reasonable assurance regarding prevention or timely
detection of unauthorized acquisition, use, or disposition of the company’s
assets that could have a material effect on the financial
statements.
Because
of the inherent limitations of internal control over financial reporting,
including the possibility of collusion or improper management override of
controls, material misstatements due to error or fraud may not be prevented or
detected on a timely basis. Also, projections of any evaluation of
the effectiveness of the internal control over financial reporting to future
periods are subject to the risk that controls may become inadequate because of
changes in conditions, or that the degree of compliance with the policies or
procedures may deteriorate.
In our
opinion, the Company maintained, in all material respects, effective internal
control over financial reporting as of December 31, 2009, based on the criteria
established in Internal
Control – Integrated Framework issued by the Committee of Sponsoring
Organizations of the Treadway Commission.
We have
also audited, in accordance with the standards of the Public Company Accounting
Oversight Board (United States), the consolidated financial statements as of and
for the year ended December 31, 2009, of the Company and our report
dated February 23, 2010, expressed an unqualified opinion on those financial
statements and included explanatory paragraphs regarding the Company’s adoption
of new accounting standards.
/s/
DELOITTE & TOUCHE LLP
Denver,
Colorado
February
23, 2010
ITEM
9B. OTHER
INFORMATION
None.
PART
III
ITEM
10. DIRECTORS,
EXECUTIVE OFFICERS, AND CORPORATE GOVERNANCE
The
information required by this Item concerning St. Mary’s Directors and corporate
governance is incorporated by reference to the information provided under the
captions “Structure of the Board of Directors,” “Proposal 1 - Election of
Directors,” and “Corporate Governance” in St. Mary’s definitive proxy statement
for the 2010 annual meeting of stockholders to be filed within 120 days from
December 31, 2009. The information required by the Item
concerning St. Mary’s executive officers is incorporated by reference to the
information provided in Part I – Item 4A – EXECUTIVE OFFICERS OF THE REGISTRANT,
included in this Form 10-K.
The
information required by this Item concerning compliance with Section 16(a) of
the Securities Exchange Act of 1934 is incorporated by reference to the
information provided under the caption “Section 16(a) Beneficial Ownership
Reporting Compliance” in St. Mary’s definitive proxy statement for the 2010
annual meeting of stockholders to be filed within 120 days from December 31,
2009.
ITEM
11. EXECUTIVE
COMPENSATION
The
information required by this Item is incorporated by reference to the
information provided under the captions, “Executive Compensation” and
“Director Compensation”” in St. Mary’s definitive proxy statement for the 2010
annual meeting of stockholders to be filed within 120 days from December 31,
2009.
ITEM
12. SECURITY
OWNERSHIP OF CERTAIN BENEFICIAL OWNERS AND MANAGEMENT AND RELATED STOCKHOLDER
MATTERS
The
information required by this Item concerning security ownership of certain
beneficial owners and management is incorporated by reference to the information
provided under the caption “Security Ownership of Certain Beneficial Owners and
Management” in St. Mary’s definitive proxy statement for the 2010 annual meeting
of stockholders to be filed within 120 days from December 31, 2009.
The
information required by this Item concerning securities authorized for issuance
under equity compensation plans is incorporated by reference to the information
provided under the caption “Equity Compensation Plans” in Part II, Item 5 –
Market for Registrant’s Common Equity, Related Stockholder Matter and Issuer
Purchases of Equity Securities, included in this Form 10-K.
ITEM
13. CERTAIN
RELATIONSHIPS AND RELATED TRANSACTIONS, AND DIRECTOR
INDEPENDENCE
The
information required by this Item is incorporated by reference to the
information provided under the caption “Certain Relationships and Related
Transactions,” and “Corporate Governance,” in St. Mary’s definitive proxy
statement for the 2010 annual meeting of stockholders to be filed within 120
days from December 31, 2009.
ITEM
14. PRINCIPAL
ACCOUNTANT FEES AND SERVICES
The
information required by this Item is incorporated by reference to the
information provided under the caption “Independent Accountants” and “Audit
Committee Preapproval Policy and Procedures” in St. Mary’s definitive proxy
statement for the 2010 annual meeting of stockholders to be filed within 120
days from December 31, 2009.
PART
IV
ITEM
15. EXHIBITS
AND FINANCIAL STATEMENT SCHEDULES
(a)(1)
and (a) (2) Financial Statements and Financial Statement Schedules:
|
Report of Independent
Registered Public Accounting Firm
|
F-1
|
|
Consolidated Balance
Sheets
|
F-2
|
|
Consolidated Statements of
Operations
|
F-3
|
|
Consolidated Statements of
Stockholders’ Equity and Comprehensive Income
|
F-4
|
|
Consolidated Statements of Cash
Flows
|
F-5
|
|
Notes to Consolidated Financial
Statements
|
F-7
|
All
schedules are omitted because the required information is not applicable or is
not present in amounts sufficient to require submission of the schedule or
because the information required is included in the Consolidated Financial
Statements and Notes thereto.
(b) Exhibits. The
following exhibits are filed or furnished with or incorporated by reference into
this report on Form 10-K:
|
Exhibit
Number
|
Description
|
| 2.1 |
Purchase
and Sale Agreement dated November 1, 2006, among Henry Petroleum LP, Henry
Holding LP, Henry Group, Entre Energy Partners LP, and St. Mary Land &
Exploration Company (filed as Exhibit 2.1 to the registrant’s Current
Report on Form 8-K filed on December 18, 2006, and incorporated herein by
reference)
|
| 2.2 |
Purchase
and Sale Agreement dated August 2, 2007, among Rockford Energy Partners
II, LLC and St. Mary Land & Exploration Company (filed as Exhibit 2.1
to the registrant’s Current Report on Form 8-K filed on October 5, 2007,
and incorporated herein by reference)
|
| 2.3 |
Purchase
and Sale Agreement dated December 11, 2007, among St. Mary Land &
Exploration Company, Ralph H. Smith Restated Revocable Trust Dated
8/14/97, Ralph H. Smith Trustee, Kent. J. Harrell, Trustee of the Kent J.
Harrell Revocable Trust Dated January 19, 1995, and Abraxas Operating LLC
(filed as Exhibit 2.1 to the registrant’s Current Report on Form 8-K filed
on February 1, 2008, and incorporated herein by
reference)
|
| 2.4 |
Ratification
and Joinder Agreement dated January 31, 2008, among St. Mary Land &
Exploration Company, Ralph H. Smith, Kent J. Harrell, Abraxas Operating,
LLC and Abraxas Petroleum Corporation (filed as Exhibit 2.2 to the
registrant’s Current Report on Form 8-K filed on February 1, 2008, and
incorporated herein by reference)
|
| 2.5* |
Purchase
and Sale Agreement dated December 17, 2009 and effective as of November 1,
2009, between Legacy Reserves Operating LP and St. Mary Land and
Exploration Company
|
| 2.6* |
Purchase
and Sale Agreement dated January 7, 2010 and effective as of November 1,
2009, between Sequel Energy Partners LP, Bakken Energy Partners, LLC,
Three Forks Energy Partners, LLC and St. Mary Land and Exploration
Company
|
|
Exhibit
Number
|
Description
|
| 3.1 |
Restated
Certificate of Incorporation of St. Mary Land & Exploration Company as
amended on May 25, 2005 (filed as Exhibit 3.1 to the registrant’s
Quarterly Report on Form 10-Q for the quarter ended June 30, 2005 and
incorporated herein by reference)
|
| 3.2 |
Restated
By-Laws of St. Mary Land & Exploration Company amended as of December
18, 2008 (filed as Exhibit 3.1 to the registrant’s Current Report on Form
8-K filed on December 23, 2008, and incorporated herein by
reference)
|
| 4.1 |
Shareholder
Rights Plan adopted on July 15, 1999 (filed as Exhibit 4.1 to the
registrant’s Quarterly Report on Form 10-Q/A for the quarter ended June
30, 1999 and incorporated herein by reference)
|
| 4.2 |
First
Amendment to Shareholders Rights Plan dated March 15, 2002 as adopted by
the Board of Directors on July 19, 2001 (filed as Exhibit 4.2 to the
registrant’s Annual Report on Form 10-K for the year ended December 31,
2001 and incorporated herein by reference)
|
| 4.3 |
Second
Amendment to Shareholder Rights Plan dated April 24, 2006 (filed as
Exhibit 4.1 to the registrant’s Quarterly Report on Form 10-Q for the
quarter ended March 31, 2006 and incorporated herein by
reference)
|
| 4.4 |
Indenture
related to the 3.50% Senior Convertible Notes due 2027, dated as of April
4, 2007, between St. Mary Land & Exploration Company and Wells Fargo
Bank, National Association, as trustee (including the form of 3.50% Senior
Convertible Note due 2027) (filed as Exhibit 4.1 to the registrant’s
Current Report on Form 8-K filed on April 4, 2007, and incorporated herein
by reference)
|
| 4.5 |
Registration
Rights Agreement, dated as of April 4, 2007, among St. Mary Land &
Exploration Company and Merrill Lynch, Pierce, Fenner & Smith
Incorporated and Wachovia Capital Markets, LLC, for themselves and as
representatives of the Initial Purchasers (filed Exhibit 4.2 to the
registrant’s Current Report on Form 8-K filed on April 4, 2007, and
incorporated herein by reference)
|
| 10.1† |
Stock
Option Plan, as Amended on May 22, 2003 (filed as Exhibit 99.1 to the
registrant’s Registration Statement on Form S-8 (Registration No.
333-106438) and incorporated herein by reference)
|
| 10.2† |
Incentive
Stock Option Plan, as Amended on May 22, 2003 (filed as Exhibit 99.2 to
the registrant’s Registration Statement on Form S-8 (Registration No.
333-106438) and incorporated herein by reference)
|
| 10.3† |
Cash
Bonus Plan (filed as Exhibit 10.7 to the registrant’s Registration
Statement on Form S-1 (Registration No. 333-53512) and incorporated herein
by reference)
|
| 10.4† |
Summary
Plan Description/Pension Plan dated December 30, 1994 (filed as Exhibit
10.35 to the registrant’s Annual Report on Form 10-K for the year ended
December 31, 1994 and incorporated herein by reference)
|
| 10.5† |
Non-qualified
Unfunded Supplemental Retirement Plan, as amended (filed as Exhibit 10.10
to the registrant’s Registration Statement on Form S-1 (Registration No.
333-53512) and incorporated herein by reference)
|
| 10.6† |
Employee
Stock Purchase Plan (filed as Exhibit 10.50 for the registrant’s Annual
Report on Form 10-K for the year ended December 31, 1997 and incorporated
herein by reference)
|
| 10.7† |
First
Amendment to Employee Stock Purchase Plan dated February 27, 2001 (filed
as Exhibit 10.1 to the registrant’s Quarterly Report on Form 10-Q for the
quarter ended June 30, 2001 and incorporated herein by
reference)
|
| 10.8† |
Second
Amendment to the Employee Stock Purchase Plan dated February 18, 2005
(filed as Exhibit 10.48 to the registrant’s Annual Report on Form 10-K for
the year ended December 31, 2004 and incorporated herein by
reference)
|
| 10.9† |
Form
of Change of Control Severance Agreements (filed as Exhibit 10.1 to the
registrant’s Quarterly Report on Form 10-Q for the quarter ended September
30, 2001 and incorporated herein by
reference)
|
|
Exhibit
Number
|
Description
|
| 10.10† |
Amendment
to Form of Change of Control Severance Agreement (filed as Exhibit 10.9 to
the registrant’s Quarterly Report on Form 10-Q for the quarter ended June
30, 2005 and incorporated herein by reference)
|
| 10.11 |
Amendment
to an Extension of Office Lease dated as of December 14, 2001 (filed as
Exhibit 10.45 to the registrant’s Annual Report on Form 10-K for the year
ended December 31, 2002 and incorporated herein by
reference)
|
| 10.12† |
Non-Employee
Director Stock Compensation Plan as adopted on March 27, 2003 (filed as
Exhibit 10.1 to the registrant’s Quarterly Report on Form 10-Q for the
quarter ended June 30, 2003 and incorporated herein by
reference)
|
| 10.13† |
Restricted
Stock Plan as adopted on April 18, 2004 (filed as Exhibit 10.1 to the
registrant’s Quarterly Report on Form 10-Q for the quarter ended June 30,
2004 and incorporated herein by reference)
|
| 10.14† |
Amendment
to Restricted Stock Plan, dated December 15, 2005 (filed as Exhibit 10.2
to the registrant’s Current Report on Form 8-K filed on December 19, 2005
and incorporated herein by reference)
|
| 10.15† |
Form
of Restricted Stock Unit Award Agreement under the Restricted Stock Plan
(filed as Exhibit 10.1 to the registrant’s Current Report on Form 8-K
filed on March 15, 2005 and incorporated herein by
reference)
|
| 10.16 |
Amended
and Restated Credit Agreement dated as of April 7, 2005 among St. Mary
Land & Exploration Company, Wachovia Bank, National Association, as
Administrative Agent, and the lenders party thereto (filed as Exhibit 10.1
to the registrant’s Quarterly Report on Form 10-Q for the quarter ended
March 31, 2005 and incorporated herein by reference)
|
| 10.17† |
2006
Equity Incentive Compensation Plan (filed on May 17, 2006 as Exhibit 99.1
to the registrant’s Registration Statement on Form S-8 (Registration No.
333-134221) and incorporated herein by reference)
|
| 10.18† |
Form
of Non-Employee Director Restricted Stock Award Agreement (filed as
Exhibit 10.2 to the registrant’s Current Report on Form 8-K filed on May
18, 2006 and incorporated herein by reference)
|
| 10.19 |
Guaranty
Agreement by St. Mary Energy Company in favor of Wachovia Bank, National
Association, as Administrative Agent, dated April 7, 2005 (filed as
Exhibit 10.2 to the registrant’s Quarterly Report on Form 10-Q for the
quarter ended March 31, 2005 and incorporated herein by
reference)
|
| 10.20 |
Guaranty
Agreement by Nance Petroleum Corporation in favor or Wachovia Bank,
National Association, as Administrative Agent, dated April 7, 2005 (filed
as Exhibit 10.3 to the registrant’s quarterly Report on Form 10-Q for the
quarter ended March 31, 2005 and incorporated herein by
reference)
|
| 10.21 |
Guaranty
Agreement by NPC Inc. in favor of Wachovia Bank, National Association, as
Administrative Agent, dated April 7, 2005 (filed as Exhibit 10.4 to the
registrant’s Quarterly Report on Form 10-Q for the quarter ended March 31,
2005 and incorporated herein by reference)
|
| 10.22 |
Pledge
and Security Agreement between St. Mary Land & Exploration Company and
Wachovia Bank, National Association, as Administrative Agent, dated April
7, 2005 (filed as Exhibit 10.5 to the registrant’s Quarterly Report on
Form 10-Q for the quarter ended March 31, 2005 and incorporated herein by
reference.)
|
| 10.23 |
Pledge
and Security Agreement between Nance Petroleum Corporation and Wachovia
Bank, National Association, as Administrative Agent, dated April 7, 2005
(filed as Exhibit 10.6 to the registrant’s Quarterly Report on Form 10-Q
for the quarter ended March 31, 2005 and incorporated herein by
reference.)
|
|
Exhibit
Number
|
Description
|
| 10.24 |
First
Supplement and Amendment to Deed of Trust, Mortgage, Line of Credit,
Assignment, Security Agreement, Fixture Filing and Financing Statement for
the Benefit of Wachovia Bank, National Association, as Administrative
Agent, dated effective as of April 7, 2005 (filed as Exhibit 10.7 to the
registrant’s Quarterly Report on Form 10-Q for the quarter ended March 31,
2005 and incorporated herein by reference)
|
| 10.25 |
Deed
of Trust – St. Mary Land & Exploration Company to Wachovia Bank,
National Association, as Administrative Agent, dated effective as of April
7, 2005 (filed as Exhibit 10.8 to the registrant’s Quarterly Report on
Form 10-Q for the quarter ended March 31, 2005 and incorporated herein by
reference)
|
| 10.26† |
Net
Profits Interest Bonus Plan, as Amended on December 15, 2005 (filed as
Exhibit 10.1 to the registrant’s Current Report on Form 8-K filed on
December 19, 2005 and incorporated herein by reference)
|
| 10.27† |
Summary
of Charitable Contributions in Honor of Thomas E. Congdon (filed as
Exhibit 10.4 to the registrant’s Current Report on Form 8-K filed on
December 19, 2005 and incorporated herein by reference)
|
| 10.28† |
Summary
of 2006 Base Salaries for Named Executive Officers (filed as Exhibit 10.5
to the registrant’s Current Report on Form 8-K filed on December 19, 2005
and incorporated herein by reference)
|
| 10.29† |
Employment
Agreement of A.J. Best dated May 1, 2006 (filed as Exhibit 10.1 to the
registrant’s Current Report on Form 8-K filed on May 4, 2006 and
incorporated herein by reference)
|
| 10.30*† |
Summary
of Compensation Arrangements for Non-Employee Directors
|
| 10.31 |
Purchase
Agreement, dated March 29, 2007, among St. Mary Land & Exploration
Company, Merrill Lynch & Co., Merrill Lynch, Pierce, Fenner &
Smith Incorporated, Wachovia Capital Markets, LLC, Bear Stearns & Co.
Inc., BNP Paribas Securities Corp., and UBS Securities LLC (filed as
Exhibit 10.1 to the registrant’s Current Report on Form 8-K filed on April
4, 2007, and incorporated herein by reference)
|
| 10.32 |
First
Amendment to Amended and Restated Credit Agreement, dated March 19, 2007,
among St. Mary Land & Exploration Company, the lenders party thereto,
Wachovia Bank, National Association, as issuing bank and administrative
agent, Wells Fargo Bank, N.A., as syndication agent, and BNP Paribas,
Comerica Bank-Texas and JPMorgan Chase Bank, N.A., as co-documentation
agents (filed as Exhibit 10.2 to the registrant’s Current Report on Form
8-K filed on April 4, 2007, and incorporated herein by
reference)
|
| 10.33† |
Net
Profits Interest Bonus Plan, As Amended and Restated by the Board of
Directors on July 19, 2007 (filed as Exhibit 10.1 to the registrant’s
Current Report on Form 8-K filed on July 25, 2007, and incorporated herein
by reference)
|
| 10.34† |
Cash
Bonus Plan as Amended on March 28, 2008 (filed as Exhibit 10.1 to the
registrant’s Current Report on Form 8-K filed on April 3, 2008 and
incorporated herein by reference)
|
| 10.35 |
Second
Amended and Restated Credit Agreement dated April 10, 2008, among St. Mary
Land & Exploration Company, the lenders party thereto, Wachovia Bank,
National Association, as Administrative Agent, Wells Fargo Bank, N.A., as
syndication agent, and BNP Paribas, Comerica Bank and JPMorgan Chase Bank,
N.A., as co-documentation agents (filed as Exhibit 10.1 to the
registrant’s Quarterly Report on Form 10-Q filed on May 5, 2008 and
incorporated herein by reference)
|
| 10.36† |
2006
Equity Incentive Compensation Plan as Amended and Restated as of March 28,
2008 (filed as Exhibit 10.1 to the registrant’s Current Report on Form 8-K
filed on May 27, 2008 and incorporated herein by
reference)
|
| 10.37† |
Form
of Performance Share Award Agreement (filed as Exhibit 10.4 to the
registrant’s Quarterly Report on Form 10-Q filed on August 5, 2008 and
incorporated herein by reference)
|
| 10.38† |
Form
of Performance Share Award Notice (filed as Exhibit 10.5 to the
registrant’s Quarterly Report on Form 10-Q filed on August 5, 2008 and
incorporated herein by reference)
|
|
Exhibit
Number
|
Description
|
| 10.39 |
Third
Amended and Restated Credit Agreement dated April 14, 2009 among St. Mary
Land & Exploration Company, Wachovia Bank, National Association, as
Administrative Agent, and the Lenders party thereto (filed as Exhibit 10.1
to the registrant’s Current Report on Form 8-K filed on April 20, 2009,
and incorporated herein by reference)
|
| 10.40 |
Supplement
and Amendment to Deed of Trust, Mortgage, Line of Credit Mortgage,
Assignment, Security Agreement, Fixture Filing and Financing Statement for
the benefit of Wachovia Bank, National Association, as Administrative
Agent, dated effective as of April 14, 2009 (filed as Exhibit 10.2 to the
registrant’s Current Report on Form 8-K filed on April 20, 2009, and
incorporated herein by reference)
|
| 10.41 |
Deed
of Trust to Wachovia Bank, National Association, as Administrative Agent,
dated effective as of April 14, 2009 (filed as Exhibit 10.3 to the
registrant’s Current Report on Form 8-K filed on April 20, 2009, and
incorporated herein by reference)
|
| 10.42† |
Equity
Incentive Compensation Plan as Amended and Restated as of March 26, 2009
(filed as Exhibit 10.1 to the registrant’s Current Report on Form 8-K
filed on May 27, 2009)
|
| 10.43† |
St.
Mary Land & Exploration Company Form of Performance Share and
Restricted Stock Unit Award Agreement (filed as Exhibit 10.5 to the
registrant’s Quarterly Report on Form 10-Q for the quarter ended June 30,
2009, and incorporated herein by reference)
|
| 10.44† |
St.
Mary Land & Exploration Company Form of Performance Share and
Restricted Stock Unit Award Notice (filed as Exhibit 10.6 to the
registrant’s Quarterly Report on Form 10-Q for the quarter ended June 30,
2009, and incorporated herein by reference)
|
| 10.45† |
Third
Amendment to St. Mary Land & Exploration Company Employee Stock
Purchase Plan dated September 23, 2009 (filed as Exhibit 10.3 to the
registrant’s Quarterly Report on Form 10-Q for the quarter ended September
30, 2009, and incorporated herein by reference)
|
| 10.46*† | Fourth Amendment to St. Mary Land & Exploration Company Employee Stock Purchase Plan dated December 29, 2009 |
| 21.1* |
Subsidiaries
of Registrant
|
| 23.1* |
Consent
of Deloitte & Touche LLP
|
| 23.2* |
Consent
of Ryder Scott Company L.P.
|
| 23.3* |
Consent
of Netherland, Sewell & Associates, Inc.
|
| 24.1* |
Power
of Attorney
|
| 31.1* |
Certification
of Chief Executive Officer pursuant to Section 302 of the Sarbanes – Oxley
Act of 2002
|
| 31.2* |
Certification
of Chief Financial Officer pursuant to Section 302 of the Sarbanes – Oxley
Act of 2002
|
| 32.1** |
Certification
pursuant to U.S.C. Section 1350 as adopted pursuant to Section 906 of the
Sarbanes- Oxley Act of 2002
|
| 99.1* |
Ryder
Scott Audit Letter
|
* Filed
with this Form 10-K
**
Furnished with this Form 10-K
† Exhibit
constitutes a management contract or compensatory plan or
agreement.
(c) Financial Statement
Schedules. See Item 15(a) above.
REPORT OF
INDEPENDENT REGISTERED PUBLIC ACCOUNTING FIRM
To the
Board of Directors and Stockholders of
St. Mary
Land & Exploration Company and Subsidiaries
Denver,
Colorado
We have
audited the accompanying consolidated balance sheets of St. Mary Land &
Exploration Company and subsidiaries (the “Company”) as of December 31, 2009 and
2008, and the related consolidated statements of operations, stockholders’
equity and comprehensive income (loss), and cash flows for each of the three
years in the period ended December 31, 2009. These financial
statements are the responsibility of the Company’s management. Our
responsibility is to express an opinion on the financial statements based on our
audits.
We
conducted our audits in accordance with the standards of the Public Company
Accounting Oversight Board (United States). Those standards require
that we plan and perform the audit to obtain reasonable assurance about whether
the financial statements are free of material misstatement. An audit
includes examining, on a test basis, evidence supporting the amounts and
disclosures in the financial statements. An audit also includes
assessing the accounting principles used and significant estimates made by
management, as well as evaluating the overall financial statement
presentation. We believe that our audits provide a reasonable basis
for our opinion.
In our
opinion, such consolidated financial statements present fairly, in all material
respects, the financial position of St. Mary Land & Exploration Company and
subsidiaries as of December 31, 2009 and 2008, and the results of their
operations and their cash flows for each of the three years in the period ended
December 31, 2009, in conformity with accounting principles generally accepted
in the United States of America.
As
discussed in Note 1 to the consolidated financial statements, the Company
changed its method of oil and gas reserve estimation and related required
disclosures in 2009 with the implementation of new accounting
guidance.
As
discussed in Note 5 to the consolidated financial statements, the Company
changed its method of accounting for convertible debt in 2009.
We have
also audited, in accordance with the standards of the Public Company Accounting
Oversight Board (United States), the Company’s internal control over financial
reporting as of December 31, 2009, based on the criteria established in Internal Control – Integrated
Framework issued by the Committee of Sponsoring Organizations of the
Treadway Commission, and our report dated February 23, 2010, expressed an
unqualified opinion on the Company’s internal control over financial
reporting.
/s/
DELOITTE & TOUCHE LLP
Denver,
Colorado
February
23, 2010